Page 202 - HIVMED_v21_i1.indb
P. 202

Page 8 of 15  Original Research


                                                             A1                                                  B1
                  110                                               50

                  100                                               40                                      +1.96 SD

                   90                                               30                                         33.3

                i-STAT 4hr mol/I  80                              (enzyma c 4hr - i-STAT 4hr) / Mean %  20    Mean

                   70
                                                                    10
                                                                                                               12.2
                   60                                                0

                   50                                               –10                                     –1.96 SD
                                                                                                               -9.0
                   40                                               –20
                     40    50   60    70    80    90   100   110       40    50    60    70    80    90   100   110
                                   Enzyma c 4hr μmol/I                       Mean of enzyma c 4hr and i-STAT4hr μmol/I

                                                             A2                                                  B2
                  110                                               40

                  100                                               30                                      +1.96 SD
                   90                                               20                                        27.1
                i-STAT 6hr mol/I  70                              (enzyma c 6hr - i-STAT 6hr) / Mean %  10 0  Mean
                   80
                                                                                                               7.4
                   60

                   50                                               –10                                     -1.96 SD
                                                                                                              -12.4
                   40                                               –20
                   30                                               –30
                     30   40   50   60   70   80   90   100  110       40    50    60    70    80    90   100   110
                                   Enzyma c 6hr μmol/I                       Mean of enzyma c 6hr and i-STAT 6hr μmol/I
                                                             A3                                                  B3
                  110                                               40
                                                                    35                                      +1.96 SD
                  100                                               30                                        31.9

                   90                                               25
                i-STAT 24hr mol/I  80                             (enzyma c 24hr - i-STAT 24hr) / Mean %  15  Mean
                                                                    20
                                                                                                              16.1
                   70
                                                                    10
                   60                                                5                                      -1.96 SD

                   50                                                -5 0                                      0.2
                   40                                               -10
                     40    50    60   70    80    90   100   110       40    50    60    70    80    90   100   110
                                  Enzyma c 24hr μmol/I                      Mean of enzyma c 24hr and i-STAT 24hr μmol/I
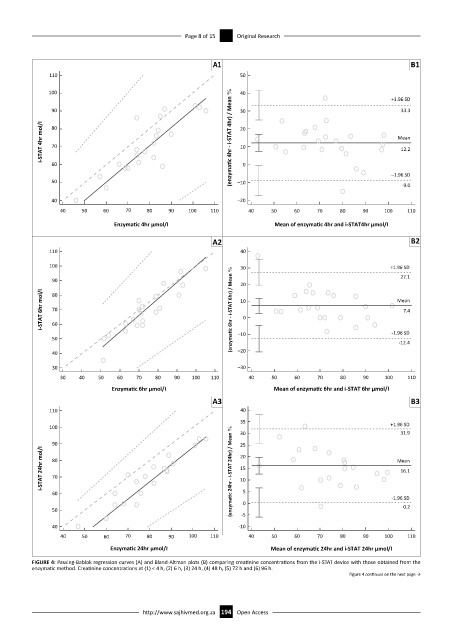
              FIGURE 4: Passing-Bablok regression curves (A) and Bland-Altman plots (B) comparing creatinine concentrations from the i-STAT device with those obtained from the
              enzymatic method. Creatinine concentrations at (1) < 4 h, (2) 6 h, (3) 24 h, (4) 48 h, (5) 72 h and (6) 96 h.
                                                                                                 Figure 4 continues on the next page →


                                           http://www.sajhivmed.org.za 194  Open Access
   197   198   199   200   201   202   203   204   205   206   207