Page 203 - HIVMED_v21_i1.indb
P. 203

Page 9 of 15  Original Research


                                                             A4                                                  B4

                 110                                                50
                 100                                                40

                  90                                                30                                      +1.96 SD
                                                                                                              34.1
                i-STAT 48hr mol/I  80                             (enzyma c 48hr - i-STAT 48hr) / Mean %  20  Mean
                  70
                                                                                                              15.8
                                                                    10
                  60
                  50                                                 0                                      -1.96 SD
                                                                                                               -2.8
                  40                                                –10
                    40    50    60   70    80    90   100 110         40     50    60    70    80    90   100   110
                                 Enzyma c 48hr μmol/I                    Mean of enzyma c 48hr and i-STAT 48hr μmol/I
                                                             A5                                                  B5
                 100                                                40
                  90                                                30                                      +1.96 SD
                                                                                                              30.3
                i-STAT 72hr mol/I  70                             (enzyma c 72hr - i-STAT  72hr) / Mean %  10 0  Mean
                                                                    20
                  80
                                                                                                              12.3
                  60

                  50                                                –10                                     -1.96 SD

                  40                                                –20
                    40     50    60     70     80    90     100       40     50     60     70     80     90     100
                                 Enzyma c 72hr μmol/I                       Mean of enzyma c 72hr and i-STAT 72hr μmol/I
                                                             A6                                                  B6
                 100                                                60

                  90                                                50                                     +1.96 SD
                                                                                                              43.3
                                                                    40
                i-STAT 96hr mol/I  70                             (enzyma c 96hr - i-STAT  96hr) / Mean %  30  Mean
                  80
                                                                    20
                                                                                                              18.0
                                                                    10
                  60
                  50                                                –10 0                                  -1.96 SD
                                                                                                               -7.3
                  40                                                –20
                    40     50    60     70     80    90     100        50      60      70       80      90      100
                                 Enzyma c 96hr μmol/I                       Mean of enzyma c 96hr and i-STAT 96hr μmol/I
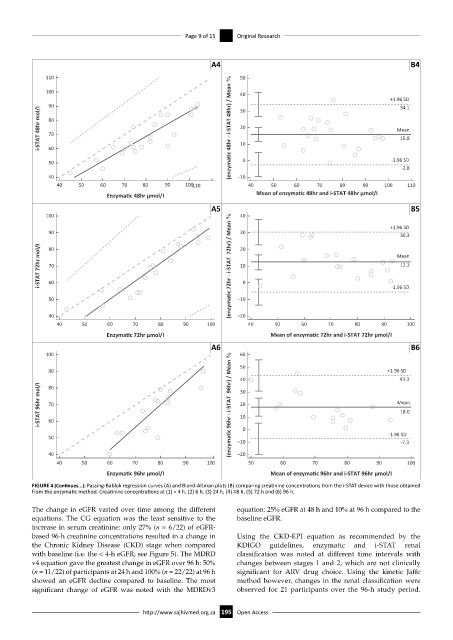
              FIGURE 4 (Continues...): Passing-Bablok regression curves (A) and Bland-Altman plots (B) comparing creatinine concentrations from the i-STAT device with those obtained
              from the enzymatic method. Creatinine concentrations at (1) < 4 h, (2) 6 h, (3) 24 h, (4) 48 h, (5) 72 h and (6) 96 h.

              The change in eGFR varied over time among the different   equation: 25% eGFR at 48 h and 10% at 96 h compared to the
              equations.  The  CG equation  was  the least  sensitive  to  the   baseline eGFR.
              increase in serum creatinine: only 27% (n = 6/22) of eGFR-
              based 96-h creatinine concentrations resulted in a change in   Using  the CKD-EPI equation  as recommended  by the
              the Chronic Kidney Disease (CKD) stage when compared   KDIGO  guidelines,  enzymatic  and  i-STAT  renal
              with baseline (i.e. the < 4-h eGFR; see Figure 5). The MDRD   classification was noted at different time intervals with
              v4 equation gave the greatest change in eGFR over 96 h: 50%   changes between stages 1 and 2, which are not clinically
              (n = 11/22) of participants at 24 h and 100% (n = 22/22) at 96 h   significant for  ARV drug choice. Using the kinetic Jaffe
              showed  an  eGFR  decline  compared  to  baseline.  The  most   method however, changes in the renal classification were
              significant change of eGFR was noted with the MDRDv3   observed for 21 participants over the 96-h study period.

                                           http://www.sajhivmed.org.za 195  Open Access
   198   199   200   201   202   203   204   205   206   207   208