
Page 204 - HIVMED_v21_i1.indb
P. 204
Page 10 of 15 Original Research
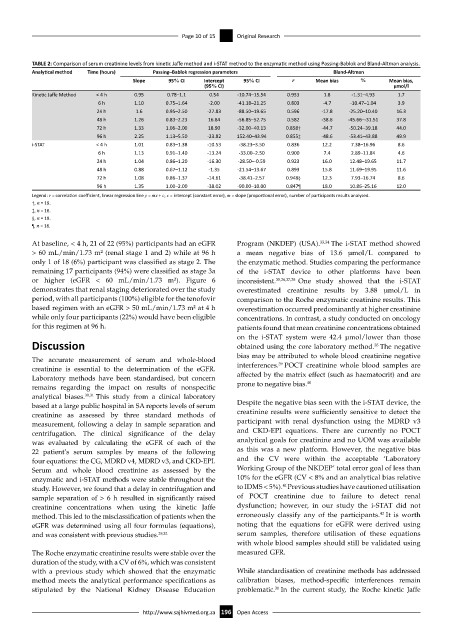
TABLE 2: Comparison of serum creatinine levels from kinetic Jaffe method and i-STAT method to the enzymatic method using Passing-Bablok and Bland-Altman analysis.
Analytical method Time (hours) Passing–Bablok regression parameters Bland-Altman
Slope 95% CI Intercept 95% CI r Mean bias % Mean bias,
(95% CI) µmol/l
Kinetic Jaffe Method < 4 h 0.95 0.78–1.1 0.54 -10.74–15.54 0.953 1.8 -1.31–4.93 1.7
6 h 1.10 0.75–1.64 -2.00 -41.18–21.25 0.803 -4.7 -10.47–1.04 3.9
24 h 1.6 0.95–2.50 -27.83 -88.50–19.65 0.596 -17.8 -25.20–10.40 16.3
48 h 1.26 0.83–2.23 16.84 -56.85–52.75 0.582 -38.6 -45.66–-31.51 37.8
72 h 1.33 1.06–2.00 18.90 -32.00–40.13 0.858† -44.7 -50.24–39.18 44.0
96 h 2.25 1.13–5.50 -23.82 152.40–43.94 0.855‡ -48.6 -53.41–43.88 49.9
i-STAT < 4 h 1.01 0.83–1.38 -10.53 -38.23–3.50 0.836 12.2 7.38–16.96 8.6
6 h 1.13 0.91–1.40 -13.24 -33.00–2.50 0.900 7.4 2.89–11.84 4.6
24 h 1.04 0.86–1.20 -16.30 -28.50–-0.59 0.923 16.0 12.48–19.65 11.7
48 h 0.88 0.67–1.12 -1.35 -21.54–13.67 0.893 15.8 11.69–19.95 11.6
72 h 1.08 0.86–1.37 -14.61 -38.41–2.57 0.948§ 12.3 7.93–16.74 8.6
96 h 1.35 1.00–2.00 -38.02 -90.00–10.00 0.847¶ 18.0 10.86–25.16 12.0
Legend: r = correlation coefficient, linear regression line y = mx + c, c = intercept (constant error), m = slope (proportional error), number of participants results analysed.
†, n = 19.
‡, n = 16.
§, n = 19.
¶, n = 16.
At baseline, < 4 h, 21 of 22 (95%) participants had an eGFR Program (NKDEP) (USA). 33,34 The i-STAT method showed
> 60 mL/min/1.73 m² (renal stage 1 and 2) while at 96 h a mean negative bias of 13.6 µmol/L compared to
only 1 of 18 (6%) participant was classified as stage 2. The the enzymatic method. Studies comparing the performance
remaining 17 participants (94%) were classified as stage 3a of the i-STAT device to other platforms have been
or higher (eGFR < 60 mL/min/1.73 m²). Figure 6 inconsistent. 35,36,37,38 One study showed that the i-STAT
demonstrates that renal staging deteriorated over the study overestimated creatinine results by 3.88 µmol/L in
period, with all participants (100%) eligible for the tenofovir comparison to the Roche enzymatic creatinine results. This
based regimen with an eGFR > 50 mL/min/1.73 m² at 4 h overestimation occurred predominantly at higher creatinine
while only four participants (22%) would have been eligible concentrations. In contrast, a study conducted on oncology
for this regimen at 96 h. patients found that mean creatinine concentrations obtained
on the i-STAT system were 42.4 µmol/lower than those
Discussion obtained using the core laboratory method. The negative
35
bias may be attributed to whole blood creatinine negative
The accurate measurement of serum and whole-blood 39
creatinine is essential to the determination of the eGFR. interferences. POCT creatinine whole blood samples are
Laboratory methods have been standardised, but concern affected by the matrix effect (such as haematocrit) and are
40
remains regarding the impact on results of nonspecific prone to negative bias.
analytical biases. 30,31 This study from a clinical laboratory
based at a large public hospital in SA reports levels of serum Despite the negative bias seen with the i-STAT device, the
creatinine as assessed by three standard methods of creatinine results were sufficiently sensitive to detect the
measurement, following a delay in sample separation and participant with renal dysfunction using the MDRD v3
centrifugation. The clinical significance of the delay and CKD-EPI equations. There are currently no POCT
was evaluated by calculating the eGFR of each of the analytical goals for creatinine and no UOM was available
22 patient’s serum samples by means of the following as this was a new platform. However, the negative bias
four equations: the CG, MDRD v4, MDRD v3, and CKD-EPI. and the CV were within the acceptable ‘Laboratory
Serum and whole blood creatinine as assessed by the Working Group of the NKDEP’ total error goal of less than
enzymatic and i-STAT methods were stable throughout the 10% for the eGFR (CV < 8% and an analytical bias relative
41
study. However, we found that a delay in centrifugation and to IDMS < 5%). Previous studies have cautioned utilisation
sample separation of > 6 h resulted in significantly raised of POCT creatinine due to failure to detect renal
creatinine concentrations when using the kinetic Jaffe dysfunction; however, in our study the i-STAT did not
42
method. This led to the misclassification of patients when the erroneously classify any of the participants. It is worth
eGFR was determined using all four formulas (equations), noting that the equations for eGFR were derived using
and was consistent with previous studies. 29,32 serum samples, therefore utilisation of these equations
with whole blood samples should still be validated using
The Roche enzymatic creatinine results were stable over the measured GFR.
duration of the study, with a CV of 6%, which was consistent
with a previous study which showed that the enzymatic While standardisation of creatinine methods has addressed
method meets the analytical performance specifications as calibration biases, method-specific interferences remain
stipulated by the National Kidney Disease Education problematic. In the current study, the Roche kinetic Jaffe
30
http://www.sajhivmed.org.za 196 Open Access