
Page 206 - HIVMED_v21_i1.indb
P. 206
Page 12 of 15 Original Research
120 CG MDRD3 MDRD4 CKP EPI
100
100 95 95 82%
Percentage change for eGFR 80 50 77 73
90
100
67
60
40
24
14
20 19 9 24 24 10 5
0
0%
4 6 24 48 72 96
Time of analysis (hours)
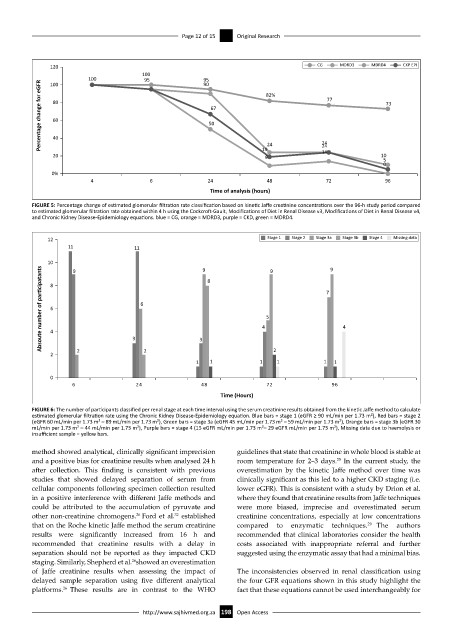
FIGURE 5: Percentage change of estimated glomerular filtration rate classification based on kinetic Jaffe creatinine concentrations over the 96-h study period compared
to estimated glomerular filtration rate obtained within 4 h using the Cockcroft-Gault, Modifications of Diet in Renal Disease v3, Modifications of Diet in Renal Disease v4,
and Chronic Kidney Disease-Epidemiology equations. blue = CG, orange = MDRD3, purple = CKD, green = MDRD4.
12 Stage 1 Stage 2 Stage 3a Stage 3b Stage 4 Missing data
11 11
10 8 9 9 8 9 9
Absoute number of par cipatants 6 4 6 4 5 7 4
2 2 3 2 3 2
1 1 1 1 1 1
0
6 24 48 72 96
Time (Hours)
FIGURE 6: The number of participants classified per renal stage at each time interval using the serum creatinine results obtained from the kinetic Jaffe method to calculate
estimated glomerular filtration rate using the Chronic Kidney Disease-Epidemiology equation. Blue bars = stage 1 (eGFR ≥ 90 mL/min per 1.73 m²), Red bars = stage 2
(eGFR 60 mL/min per 1.73 m² – 89 mL/min per 1.73 m²), Green bars = stage 3a (eGFR 45 mL/min per 1.73 m² – 59 mL/min per 1.73 m²), Orange bars = stage 3b (eGFR 30
mL/min per 1.73 m² – 44 mL/min per 1.73 m²), Purple bars = stage 4 (15 eGFR mL/min per 1.73 m²– 29 eGFR mL/min per 1.73 m²), Missing data due to haemolysis or
insufficient sample = yellow bars.
method showed analytical, clinically significant imprecision guidelines that state that creatinine in whole blood is stable at
and a positive bias for creatinine results when analysed 24 h room temperature for 2–3 days. In the current study, the
25
after collection. This finding is consistent with previous overestimation by the kinetic Jaffe method over time was
studies that showed delayed separation of serum from clinically significant as this led to a higher CKD staging (i.e.
cellular components following specimen collection resulted lower eGFR). This is consistent with a study by Drion et al.
in a positive interference with different Jaffe methods and where they found that creatinine results from Jaffe techniques
could be attributed to the accumulation of pyruvate and were more biased, imprecise and overestimated serum
other non-creatinine chromogens. Ford et al. established creatinine concentrations, especially at low concentrations
26
32
that on the Roche kinetic Jaffe method the serum creatinine compared to enzymatic techniques. 29 The authors
results were significantly increased from 16 h and recommended that clinical laboratories consider the health
recommended that creatinine results with a delay in costs associated with inappropriate referral and further
separation should not be reported as they impacted CKD suggested using the enzymatic assay that had a minimal bias.
staging. Similarly, Shepherd et al. showed an overestimation
26
of Jaffe creatinine results when assessing the impact of The inconsistencies observed in renal classification using
delayed sample separation using five different analytical the four GFR equations shown in this study highlight the
platforms. 26 These results are in contrast to the WHO fact that these equations cannot be used interchangeably for
http://www.sajhivmed.org.za 198 Open Access