
Page 201 - HIVMED_v21_i1.indb
P. 201
Page 7 of 15 Original Research
A4 B4
160 10
0 +1.96 SD
140 -10 -7.3
120 -20
Jaffe 48 hr μmol/l 100 (enzyma c 48hr - jaffe 48hr) / Mwan % -40 Mean
-30
-38.6
-50
80
-70
60 -60 -1.96 SD
-69.8
-85
40 -90
40 60 80 100 120 140 160 50 60 70 80 90 100 110 120
Enzyma c 48hr μmol/l Mean of enzyma c 48hr and jaffe 48hr μmol/l
A5 B5
160 -10
140 -20 +1.96 SD
-22.2
120 -30
Jaffe 72hr μmol/l 100 (enzyma c 72hr - Jaffe 72hr) / Mean % -40 Mean
-44.7
-50
80
60 -60 -1.96 SD
-70
-67.2
40 -80
40 60 80 100 120 140 160 60 80 100 120 140
Enzyma c 72hr μmol/l Mean of enzyma c 72hr and Jaffe 72hr μmol/l
A6 B6
160 -20
140 -30 +1.96 SD
-31.1
-40
Jaffe 96hr μmol/l 120 (enzyma c 96hr - Jaffe 96hr) / Mean % -50 Mean
-48.6
100
80 -60 -1.96 SD
-66.2
-70
60 -80
60 80 100 120 140 160 70 80 90 100 110 120 130
Enzyma c 96hr μmol/l Mean of enzyma c 96hr and Jaffe 96hr μmol/l
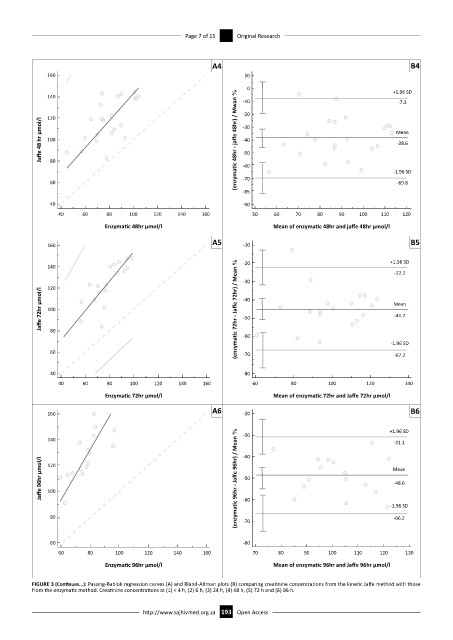
FIGURE 3 (Continues...): Passing-Bablok regression curves (A) and Bland-Altman plots (B) comparing creatinine concentrations from the kinetic Jaffe method with those
from the enzymatic method. Creatinine concentrations at (1) < 4 h, (2) 6 h, (3) 24 h, (4) 48 h, (5) 72 h and (6) 96 h.
http://www.sajhivmed.org.za 193 Open Access