
Page 198 - HIVMED_v21_i1.indb
P. 198
Page 4 of 15 Original Research
70.14 µmol/L ± 15.3 µmol/L: p > 0.05 for all comparisons 8.9% of the enzymatic creatinine results fell outside the
(Table 1). The mean creatinine concentrations analysed UOM for the duration of the study compared to 65% of the
using the kinetic Jaffe method were significantly higher results for the kinetic Jaffe method. The i-STAT results could
than baseline when blood samples were processed after 6 h: not be evaluated as UOM has not been established for this
p ≤ 0.001 for all comparisons. Creatinine concentrations did assay.
not change significantly over the 96 h when measured using
the enzymatic method or i-STAT system: p > 0.05 for all Based on the positive trend of increasing creatinine
comparisons (Table 1). concentrations over time observed for the Jaffe method, we
explored the data further to determine if a correction factor
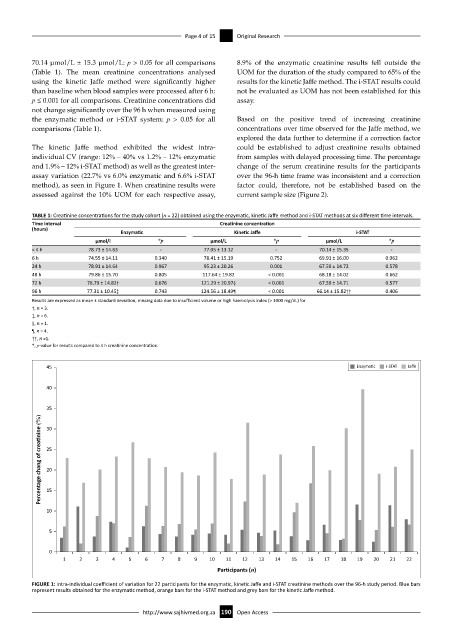
The kinetic Jaffe method exhibited the widest intra- could be established to adjust creatinine results obtained
individual CV (range: 12% – 40% vs 1.2% – 12% enzymatic from samples with delayed processing time. The percentage
and 1.9% – 12% i-STAT method) as well as the greatest inter- change of the serum creatinine results for the participants
assay variation (22.7% vs 6.0% enzymatic and 6.6% i-STAT over the 96-h time frame was inconsistent and a correction
method), as seen in Figure 1. When creatinine results were factor could, therefore, not be established based on the
assessed against the 10% UOM for each respective assay, current sample size (Figure 2).
TABLE 1: Creatinine concentrations for the study cohort (n = 22) obtained using the enzymatic, kinetic Jaffe method and i-STAT methods at six different time intervals.
Time interval Creatinine concentration
(hours)
Enzymatic Kinetic Jaffe i-STAT
µmol/l *p µmol/L *p µmol/L *p
< 4 h 78.73 ± 14.63 - 77.05 ± 13.12 - 70.14 ± 15.35 -
6 h 74.55 ± 14.11 0.340 78.41 ± 15.19 0.752 69.91 ± 16.00 0.962
24 h 78.91 ± 14.64 0.967 95.23 ± 20.26 0.001 67.59 ± 14.72 0.578
48 h 79.86 ± 15.70 0.805 117.64 ± 19.82 < 0.001 68.18 ± 14.02 0.662
72 h 76.79 ± 14.82† 0.676 121.29 ± 20.97§ < 0.001 67.59 ± 14.71 0.577
96 h 77.31 ± 10.45‡ 0.743 124.56 ± 18.49¶ < 0.001 66.14 ± 15.82†† 0.406
Results are expressed as mean ± standard deviation, missing data due to insufficient volume or high haemolysis index (> 1000 mg/dL) for
†, n = 3.
‡, n = 6.
§, n = 1.
¶, n = 4.
††, n =1.
*, p-value for results compared to 4 h creatinine concentration.
45 Enzyma c i-STAT Jaffe
40
35
Percentage chang of crea nine (%) 25
30
20
15
10
5
0
1 2 3 4 5 6 7 8 9 10 11 12 13 14 15 16 17 18 19 20 21 22
Par cipants (n)
FIGURE 1: Intra-individual coefficient of variation for 22 participants for the enzymatic, kinetic Jaffe and i-STAT creatinine methods over the 96-h study period. Blue bars
represent results obtained for the enzymatic method, orange bars for the i-STAT method and grey bars for the kinetic Jaffe method.
http://www.sajhivmed.org.za 190 Open Access