
Page 199 - HIVMED_v21_i1.indb
P. 199
Page 5 of 15 Original Research
120 4-6 hour 4-24 hour 4-48 hour 4-72 hour 4-96 hour
100
80
Percentage change of crea nine (%) 40
60
20
0
-20
-40
1 2 3 4 5 6 7 8 9 10 11 12 13 14 15 16 17 18 19 20 21 22
Par cipants (n)
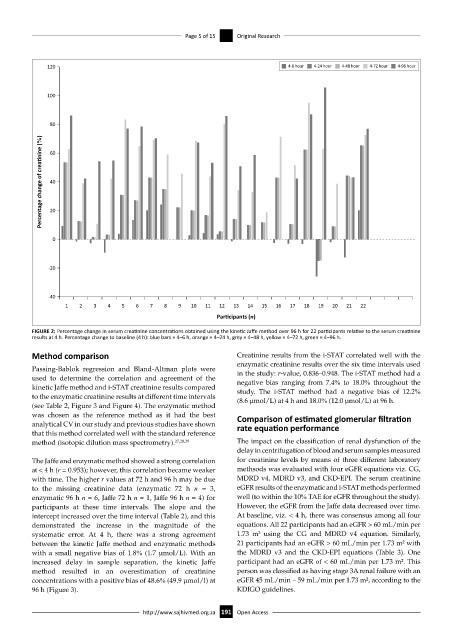
FIGURE 2: Percentage change in serum creatinine concentrations obtained using the kinetic Jaffe method over 96 h for 22 participants relative to the serum creatinine
results at 4 h. Percentage change to baseline (4 h): blue bars = 4–6 h, orange = 4–24 h, grey = 4–48 h, yellow = 4–72 h, green = 4–96 h.
Method comparison Creatinine results from the i-STAT correlated well with the
enzymatic creatinine results over the six time intervals used
Passing-Bablok regression and Bland-Altman plots were in the study: r-value, 0.836–0.948. The i-STAT method had a
used to determine the correlation and agreement of the negative bias ranging from 7.4% to 18.0% throughout the
kinetic Jaffe method and i-STAT creatinine results compared study. The i-STAT method had a negative bias of 12.2%
to the enzymatic creatinine results at different time intervals (8.6 µmol/L) at 4 h and 18.0% (12.0 µmol/L) at 96 h.
(see Table 2, Figure 3 and Figure 4). The enzymatic method
was chosen as the reference method as it had the best Comparison of estimated glomerular filtration
analytical CV in our study and previous studies have shown rate equation performance
that this method correlated well with the standard reference
method (isotopic dilution mass spectrometry). 27,28,29 The impact on the classification of renal dysfunction of the
delay in centrifugation of blood and serum samples measured
The Jaffe and enzymatic method showed a strong correlation for creatinine levels by means of three different laboratory
at < 4 h (r = 0.953); however, this correlation became weaker methsods was evaluated with four eGFR equations viz. CG,
with time. The higher r values at 72 h and 96 h may be due MDRD v4, MDRD v3, and CKD-EPI. The serum creatinine
to the missing creatinine data (enzymatic 72 h n = 3, eGFR results of the enzymatic and i-STAT methods performed
enzymatic 96 h n = 6, Jaffe 72 h n = 1, Jaffe 96 h n = 4) for well (to within the 10% TAE for eGFR throughout the study).
participants at these time intervals. The slope and the However, the eGFR from the Jaffe data decreased over time.
intercept increased over the time interval (Table 2), and this At baseline, viz. < 4 h, there was consensus among all four
demonstrated the increase in the magnitude of the equations. All 22 participants had an eGFR > 60 mL/min per
systematic error. At 4 h, there was a strong agreement 1.73 m² using the CG and MDRD v4 equation. Similarly,
between the kinetic Jaffe method and enzymatic methods 21 participants had an eGFR > 60 mL/min per 1.73 m² with
with a small negative bias of 1.8% (1.7 µmol/L). With an the MDRD v3 and the CKD-EPI equations (Table 3). One
increased delay in sample separation, the kinetic Jaffe participant had an eGFR of < 60 mL/min per 1.73 m². This
method resulted in an overestimation of creatinine person was classified as having stage 3A renal failure with an
concentrations with a positive bias of 48.6% (49.9 µmol/l) at eGFR 45 mL/min – 59 mL/min per 1.73 m², according to the
96 h (Figure 3). KDIGO guidelines.
http://www.sajhivmed.org.za 191 Open Access