
Page 368 - SAHCS HIVMed Journal Vol 20 No 1 2019
P. 368
Page 7 of 12 Original Research
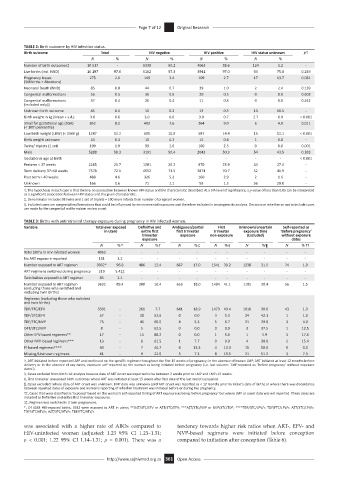
TABLE 2: Birth outcome by HIV infection status.
Birth outcome Total HIV negative HIV positive HIV status unknown p†
N % N % N % N %
Number of birth outcomes‡ 10 517 - 6330 60.2 4063 38.6 124 1.2 -
Live births (incl. NND) 10 197 97.0 6162 97.3 3941 97.0 94 75.8 0.249
Pregnancy losses 275 2.6 149 2.4 109 2.7 17 13.7 0.081
(Stillbirths + Abortions)
Neonatal Death (NND) 85 0.8 44 0.7 39 1.0 2 2.4 0.139
Congenital malformations 56 0.5 36 0.6 20 0.5 0 0.0 0.603
Congenital malformations 37 0.4 26 0.4 11 0.3 0 0.0 0.242
(included only)§
Unknown birth outcome 45 0.4 10 0.3 13 0.3 13 10.5 -
Birth weight in kg (Mean + s.d.) 3.0 0.6 3.0 0.6 3.0 0.7 2.7 0.9 < 0.001
Small for gestational age (SGA) 852 8.1 482 7.6 364 9.0 6 4.8 0.011
(< 10th percentile)
Low birth weight (LBW) (< 2500 g) 1287 12.2 685 10.8 587 14.4 15 12.1 < 0.001
Birth weight unknown 34 0.3 18 0.3 15 0.4 1 0.8 -
Twins/ triplets (1 set) 199 1.9 99 1.6 100 2.5 0 0.0 0.001
Male 5288 50.3 3191 50.4 2043 50.3 54 43.5 0.383
Gestational age at birth - - - - - - - - < 0.001
Preterm < 37 weeks 2285 21.7 1281 20.2 970 23.9 34 27.4 -
Term delivery 37–40 weeks 7578 72.1 4652 73.5 2874 70.7 52 41.9 -
Post term > 40 weeks 488 4.6 326 5.2 160 3.9 2 1.6 -
Unknown 166 1.6 71 1.1 59 1.5 36 29.0 -
†, The hypothesis in each case is that there is no association between known HIV-status and the characteristic described. At a 5% level of significance, a p-value of less than 0.05 can be interpreted
as a significant association between HIV status and the given characteristic.
‡, Denominator includes 98 twins and 1 set of triplets = 100 more infants than number of pregnant women.
§, Included cases are congenital malformations that could be influenced by environmental exposures and therefore included in teratogenicity analysis. Decision on whether or not to include cases
are made by the congenital malformation review panel.
TABLE 3: Births with antiretroviral therapy exposure during pregnancy in HIV infected women.
Variable Total ever exposed Definitive and Ambiguous/partial First Unknown/uncertain Self-reported as
in utero entire first first trimester trimester exposure time ‘Before pregnancy’
trimester exposure non-exposure (Excluded) without exposure
exposure dates
N %* N %† N %‡ N %§ N %¶ N %††
Total births in HIV-infected women 4063 - - - - - - - - - - -
No ART exposure reported 131 3.2 - - - - - - - - - -
Number exposed to ART regimen 3932* 96.8 486 12.4 667 17.0 1541 39.2 1238 31.5 74 1.9
ART regimens switched during pregnancy 219 5.4‡‡ - - - - - - - - - -
Twin babies exposed to ART regimen 85 2.1 - - - - - - - - - -
Number exposed to ART regimen 3632 89.4 380 10.4 653 18.0 1494 41.1 1105 30.4 56 1.5
(excluding those who switched and
excluding twin births)
Regimens (excluding those who switched
and twin births)
TDF/FTC/EFV 3391 - 261 7.7 641 18.9 1473 43.4 1016 30.0 43 1.3
TDF/3TC/EFV 57 - 30 52.6 0 0.0 3 5.3 24 42.1 1 1.8
TDF/FTC/NVP 75 - 45 60.0 4 5.3 5 6.7 21 29.0 3 4.0
D4T/3TC/NVP 8 - 5 62.5 0 0.0 0 0.0 3 37.5 1 12.5
Other EFV-based regimens** 17 - 15 88.2 0 0.0 1 5.9 1 5.9 3 17.6
Other NVP-based regimens*** 13 - 8 61.5 1 7.7 0 0.0 4 30.8 2 15.4
PI-based regimens**** 30 - 7 46.7 4 13.3 4 13.3 15 50.0 0 0.0
Missing/Unknown regimens 41 - 9 22.0 3 7.3 8 19.5 21 51.2 3 7.3
†, ART initiated before reported LMP and continued on the specific regimen throughout the first 15 weeks of pregnancy; in the absence of known LMP, ART initiated at least 12 months before
delivery or in the absence of any dates, exposure self-reported by the woman as being initiated before pregnancy (i.e. last column: ‘Self-reported as ‘Before pregnancy’ without exposure
dates’).
‡, Cases excluded from birth risk analysis because date of ART onset was reported to be between 2 weeks prior to LMP and LMP+15 weeks.
§, First trimester unexposed birth outcomes where ART was initiated at least 15 weeks after first date of the last menstrual period.
¶, Cases excluded: where date of ART onset was unknown; LMP date was unknown (and ART onset was reported as < 12 months prior to infant’s date of birth) or where there was discordance
between reported dates of exposure and woman’s reporting of whether treatment was initiated before or during the pregnancy.
††, Cases that were classified as ‘Exposed’ based on the woman’s self-reported timing of ART exposure as being ‘before pregnancy’ but where LMP or onset date was not reported. These cases are
included as Definitive and entire first trimester exposures.
‡‡, Regimen was switched in 2 twin pregnancies.
*, Of 4063 HIV-exposed births, 3932 were exposed to ART in utero; **D4T/3TC/EFV or AZT/3TC/EFV; ***AZT/3TC/NVP or NVP/3TC/TDF; ****TDF/3TC/LPV/r; TDF/FTC/LPV/r; AZT/3TC/LPV/r;
TDF/3TC/ATV/r; AZT/3TC/ATV/r; TDF/FTC/ATV/r.
was associated with a higher rate of ABOs compared to tendency towards higher risk ratios when ART-, EFV- and
HIV-uninfected women (adjusted: 1.23 95% CI 1.23–1.31; NVP-based regimens were initiated before conception
p < 0.001; 1.22 95% CI 1.14–1.31; p = 0.001). There was a compared to initiation after conception (Table 6).
http://www.sajhivmed.org.za 361 Open Access