
Page 358 - SAHCS HIVMed Journal Vol 20 No 1 2019
P. 358
Page 7 of 10 Original Research
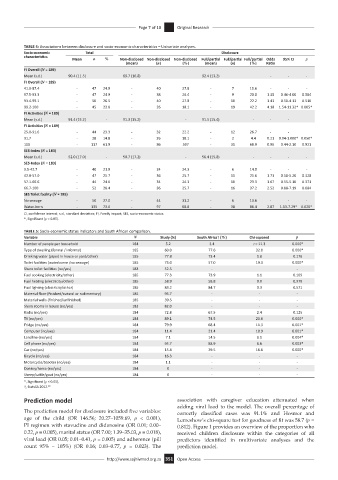
TABLE 4: Associations between disclosure and socio-economic characteristics – Univariate analyses.
Socio-economic Total Disclosure
characteristics
Mean n % Non-disclosed Non-disclosed Non-disclosed Full/partial Full/partial Full/partial Odds 95% CI p
(mean) (n) (%) (mean) (n) (%) Ratio
FI Overall (N = 189)
Mean (s.d.) 90.4 (11.5) 89.7 (10.8) 92.4 (13.2) - - -
FI Overall (N = 189)
41.9-87.4 - 47 24.9 - 40 27.8 - 7 15.6 - - -
97.5-93.3 - 47 24.9 - 38 26.4 - 9 20.0 1.35 0.46-4.00 0.584
93.4-99.1 - 50 26.5 - 40 27.8 - 10 22.2 1.43 0.50-4.13 0.510
99.2-100 - 45 23.8 - 26 18.1 - 19 42.2 4.18 1.54-11.32* 0.005*
FI Activities (N = 189)
Mean (s.d.) 91.4 (15.2) - 91.3 (15.2) - 91.5 (15.4) - - -
FI Activities (N = 189)
25.0-91.6 - 44 23.3 - 32 22.2 - 12 26.7 - -
91.7 - 28 14.8 - 26 18.1 - 2 4.4 0.21 0.04-1.000* 0.050*
100 - 117 61.9 - 86 597 - 31 68.9 0.96 0.44-2.10 0.921
SES-Index (N = 183)
Mean (s.d.) 52.0 (17.0) - 50.7 (17.2) - 56.4 (15.8) - - - -
SES-Index (N = 183)
9.5-42.7 - 40 21.9 - 34 24.3 - 6 14.0 - - -
42.8-57.0 - 47 25.7 - 36 25.7 - 11 25.6 1.73 0.58-5.20 0.328
57.1-66.6 - 44 24.0 - 34 24.3 - 10 23.3 1.67 0.55-5.10 0.371
66.7-100 - 52 28.4 - 36 25.7 - 16 37.2 2.52 0.88-7.19 0.084
SES Toilet facility (N = 185)
No sewage - 50 27.0 - 44 31.2 - 6 13.6 - - -
Water-born - 135 73.0 - 97 68.8 - 38 86.4 2.87 1.13-7.29* 0.026*
CI, confidence interval; s.d., standard deviation; FI, Family impact; SES, socio-economic status.
*, Significant (p < 0.05).
TABLE 5: Socio-economic status indicators and South African comparison.
Variable N Study (%) South Africa† (%) Chi-squared p
Number of people per household 184 5.2 3.4 t = 11.3 0.000*
Type of dwelling (formal / informal) 185 60.0 77.6 32.0 0.000*
Drinking water (piped in house or yard/other) 185 77.8 73.4 1.8 0.176
Toilet facilities (waterborne /no sewage) 185 73.0 57.0 19.3 0.000*
Share toilet facilities (no/yes) 183 52.5 - -
Fuel cooking (electricity/other) 185 77.3 73.9 1.1 0.109
Fuel heating (electricity/other) 185 58.9 58.8 0.0 0.978
Fuel lighting (electricity/other) 185 83.2 84.7 0.3 0.571
Material floor (finished/natural or rudimentary) 185 95.7 - - -
Material walls (finished/unfinished) 185 39.5 - - -
Share rooms in house (no/yes) 183 82.0 - - -
Radio (no/yes) 184 72.8 67.5 2.4 0.125
TV (no/yes) 184 89.1 74.5 20.6 0.000*
Fridge (no/yes) 184 79.9 68.4 11.3 0.001*
Computer (no/yes) 184 11.4 21.4 10.9 0.001*
Landline (no/yes) 184 7.1 14.5 8.1 0.004*
Cell phone (no/yes) 184 95.7 88.9 8.6 0.003*
Car (no/yes) 184 15.8 29.5 16.6 0.000*
Bicycle (no/yes) 184 16.3 - - -
Motorcycle/Scooter (no/yes) 184 1.1 - - -
Donkey/horse (no/yes) 184 0 - - -
Sheep/cattle/goat (no/yes) 184 0 - - -
*, Significant (p < 0.05),
†, StatsSA 2012. 20
Prediction model association with caregiver education attenuated when
adding viral load to the model. The overall percentage of
The prediction model for disclosure included five variables: correctly classified cases was 91.1% and Hosmer and
age of the child (OR 146.56; 20.27–1059.69, p < 0.001), Lemeshow’s chi-square test for goodness of fit was 58.7 (p =
PI regimen with stavudine and didanosine (OR 0.01; 0.00– 0.812). Figure 1 provides an overview of the proportion who
0.22, p = 0.005), marital status (OR 7.00; 1.39–35.03, p = 0.018), received children disclosure within the categories of all
viral load (OR 0.05; 0.01–0.41, p = 0.005) and adherence (pill predictors identified in multivariate analyses and the
count 95% – 105%) (OR 0.16; 0.03–0.77, p = 0.023). The prediction model.
http://www.sajhivmed.org.za 351 Open Access