
Page 356 - SAHCS HIVMed Journal Vol 20 No 1 2019
P. 356
Page 5 of 10 Original Research
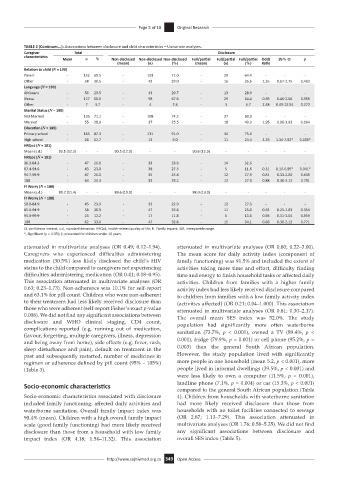
TABLE 2 (Continues...): Associations between disclosure and child characteristics – Univariate analyses.
Caregiver Total Disclosure
characteristics
Mean n % Non-disclosed Non-disclosed Non-disclosed Full/partial Full/partial Full/partial Odds 95% CI p
(mean) (n) (%) (mean) (n) (%) Ratio
Relation to child (N = 190)
Parent - 132 69.5 - 103 71.0 - 29 64.4 - - -
Other - 58 30.5 - 42 29.0 - 16 35.6 1.35 0.67-2.75 0.403
Language (N = 190)
Afrikaans - 56 29.5 - 43 29.7 - 13 28.9 - - -
Xhosa - 127 66.8 - 98 67.6 - 29 64.4 0.98 0.46-2.06 0.955
Other - 7 3.7 - 4 2.8 - 3 6.7 2.48 0.49-12.54 0.272
Marital Status (N = 190)
Not Married - 135 71.1 - 108 74.5 - 27 60.0 - - -
Married - 55 28.9 - 37 25.5 - 18 40.0 1.95 0.96-3.93 0.064
Education (N = 189)
Primary school - 165 87.3 - 131 91.0 - 34 75.6 - - -
High school - 24 12.7 - 13 9.0 - 11 24.4 3.26 1.34-7.92* 0.009*
HRQoL (N = 181)
Mean (s.d.) 90.5 (12.2) - - 90.5 (12.3) - - 90.6 (12.3) - - - - -
HRQoL (N = 181)
36.3-84.3 - 47 26.0 - 33 23.9 - 14 32.6 - - -
87.4-94.6 - 43 23.8 - 38 27.5 - 5 11.6 0.31 0.10-0.95* 0.041*
94.7-99.9 - 47 26.0 - 35 25.4 - 12 27.9 0.81 0.33-2.00 0.645
100 - 44 24.3 - 32 23.2 - 12 27.9 0.88 0.36-2.12 0.791
FI Worry (N = 188)
Mean (s.d.) 89.2 (11.4) - - 89.6 (10.9) - - 88.0 (13.0) - - - - -
FI Worry (N = 188)
50.0-84.9 - 45 23.9 - 33 22.9 - 12 27.3 - - -
85.0-94.9 - 58 30.9 - 47 32.6 - 11 25.0 0.64 0.25-1.63 0.354
95.0-99.9 - 23 12.2 - 17 11.8 - 6 13.6 0.98 0.31-3.04 0.959
100 - 62 33.0 - 47 32.6 - 15 34.1 0.88 0.36-2.12 0.771
CI, confidence interval; s.d., standard deviation; HRQoL, health-related quality of life; FI, Family impact; IQR, interquartile range.
*, Significant (p < 0.05); ‡, presented for children under 10 years.
attenuated in multivariate analyses (OR 0.49; 0.12–1.94). attenuated in multivariate analyses (OR 0.80; 0.22–3.00).
Caregivers who experienced difficulties administering The mean score for daily activity index (component of
medication (30.5%) less likely disclosed the child’s HIV family functioning) was 91.5% and included the extent of
status to the child compared to caregivers not experiencing activities taking more time and effort, difficulty finding
difficulties administering medication (OR 0.41; 0.18–0.95). time and energy to finish household tasks or affected daily
This association attenuated in multivariate analyses (OR activities. Children from families with a higher family
0.63; 0.23–1.73). Non-adherence was 10.1% for self-report activity index had less likely received disclosure compared
and 63.1% for pill count. Children who were non-adherent to children from families with a low family activity index
to their treatment had less likely received disclosure than (activities affected) (OR 0.21; 0.04–1.000). This association
those who were adherent (self-report Fisher’s exact p-value attenuated in multivariate analyses (OR 0.81; 0.30–2.17).
0.008). We did not find any significant associations between The overall mean SES index was 52.0%. The study
disclosure and WHO clinical staging, CD4 count, population had significantly more often waterborne
complications reported (e.g. running out of medication, sanitation (73.7%, p < 0.001), owned a TV (89.4%, p <
flavour, forgetting, multiple caregivers, illness, depression
and being away from home), side effects (e.g. fever, rash, 0.001), fridge (79.9%, p = 0.001) or cell phone (95.2%, p =
sleep disturbance and pain), default on treatment in the 0.003) than the general South African population.
past and subsequently restarted, number of medicines in However, the study population lived with significantly
regimen or adherence defined by pill count (95% – 105%) more people in one household (mean 5.2, p < 0.001), more
(Table 3). people lived in informal dwellings (39.5%, p < 0.001) and
were less likely to own a computer (11.5%, p = 0.001),
Socio-economic characteristics landline phone (7.1%, p = 0.004) or car (15.3%, p < 0.001)
compared to the general South African population (Table
Socio-economic characteristics associated with disclosure 4). Children from households with waterborne sanitation
included family functioning, affected daily activities and had more likely received disclosure than those from
waterborne sanitation. Overall family impact index was households with no toilet facilities connected to sewage
90.4% (mean). Children with a high overall family impact (OR 2.87; 1.13–7.29). This association attenuated in
scale (good family functioning) had more likely received multivariate analyses (OR 1.76; 0.58–5.35). We did not find
disclosure than those from a household with low family any significant associations between disclosure and
impact index (OR 4.18; 1.54–11.32). This association overall SES index (Table 5).
http://www.sajhivmed.org.za 349 Open Access