
Page 355 - SAHCS HIVMed Journal Vol 20 No 1 2019
P. 355
Page 4 of 10 Original Research
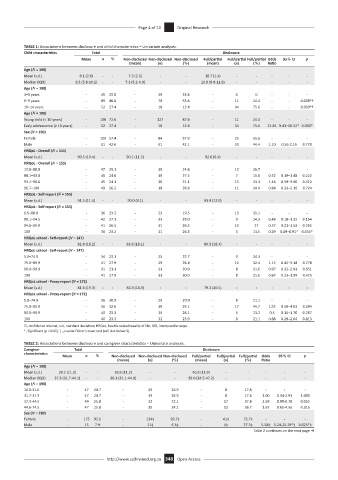
TABLE 1: Associations between disclosure and child characteristics – Univariate analyses.
Child characteristics Total Disclosure
Mean n % Non-disclosed Non-disclosed Non-disclosed Full/partial Full/partial Full/partial Odds 95% CI p
(mean) (n) (%) (mean) (n) (%) Ratio
Age (N = 190)
Mean (s.d.) 8.1 (2.6) - - 7.3 (2.3) - - 10.7 (1.4) - - - - -
Median (IQR) 8.5 (5.8-10.2) - - 7.3 (5.2-9.0) - - 10.8 (9.9-11.8) - - - - -
Age (N = 190)
3–5 years - 49 25.8 - 49 33.8 - 0 0 - - -
6–9 years - 89 46.8 - 78 53.8 - 11 24.4 - - 0.008*†
10–14 years - 52 27.4 - 18 12.4 - 34 75.6 - - 0.000*†
Age (N = 190)
Young child (< 10 years) - 138 72.6 - 127 87.6 - 11 24.4 - - -
Early adolescence (≥ 10 years) - 52 27.4 - 18 12.4 - 34 75.6 21.81 9.41–50.52* 0.000*
Sex (N = 190)
Female - 109 57.4 - 84 57.9 - 25 55.6 - - -
Male - 81 42.6 - 61 42.1 - 20 44.4 1.10 0.56-2.16 0.778
HRQoL - Overall (N = 155)
Mean (s.d.) 90.5 (10.4) - - 90.1 (11.3) - - 92.0 (6.4) - - - - -
HRQoL - Overall (N = 155)
12.8–88.0 - 47 25.1 - 35 24.6 - 12 26.7 - - -
88.1–93.0 - 46 24.6 - 39 27.5 - 7 15.6 0.52 0.19–1.48 0.222
93.1–96.6 - 45 24.1 - 30 21.1 - 15 33.3 1.46 0.59–3.60 0.412
96.7–100 - 49 26.2 - 38 26.8 - 11 24.4 0.84 0.33–2.16 0.724
HRQoL - Self-report (N = 155)
Mean (s.d.) 91.5 (11.4) - - 90.0 (9.1) - - 91.9 (12.0) - - - - -
HRQoL - Self-report (N = 155)
6.5–88.0 - 36 23.2 - 23 19.5 - 13 35.1 - - -
88.1–94.5 - 42 27.1 - 33 28.0 - 9 24.3 0.48 0.18–1.32 0.154
94.6–99.9 - 41 26.5 - 31 26.3 - 10 27 0.57 0.21–1.53 0.265
100 - 36 23.2 - 31 26.3 - 5 13.5 0.29 0.09–0.91* 0.035*
HRQoL school - Self-report (N = 147)
Mean (s.d.) 82.8 (18.2) - - 83.6 (18.1) - - 80.5 (18.4) - - - - -
HRQoL school - Self-report (N = 147)
5.0–74.9 - 34 23.1 - 25 22.7 - 9 24.3 - - -
75.0–89.9 - 41 27.9 - 29 26.4 - 12 32.4 1.15 0.42–3.18 0.778
90.0–99.9 - 31 21.1 - 23 20.9 - 8 21.6 0.97 0.32–2.93 0.951
100 - 41 27.9 - 33 30.0 - 8 21.6 0.67 0.23–1.99 0.475
HRQoL school - Proxy-report (N = 172)
Mean (s.d.) 81.6 (19.3) - - 82.3 (18.9) - - 79.3 (20.5) - - - - -
HRQoL school - Proxy-report (N = 172)
5.0–74.9 - 36 20.9 - 28 20.9 - 8 21.1 - - -
75.0–89.9 - 56 32.6 - 39 29.1 - 17 44.7 1.53 0.58–4.03 0.394
90.0–99.9 - 40 23.3 - 35 26.1 - 5 13.2 0.5 0.15–1.70 0.267
100 - 40 23.3 - 32 23.9 - 8 21.1 0.88 0.29–2.64 0.813
CI, confidence interval; s.d., standard deviation; HRQoL, health-related quality of life; IQR, interquartile range.
*, Significant (p < 0.05); †, p-value Fisher’s exact test (cell size below 5).
TABLE 2: Associations between disclosure and caregiver characteristics – Univariate analyses.
Caregiver Total Disclosure
characteristics
Mean n % Non-disclosed Non-disclosed Non-disclosed Full/partial Full/partial Full/partial Odds 95% CI p
(mean) (n) (%) (mean) (n) (%) Ratio
Age (N = 190)
Mean (s.d.) 39.2 (11.2) - - 38.6 (11.2) - - 40.8 (11.0) - - - - -
Median (IQR) 37.3 (31.7-44.1) - - 36.1 (31.1-44.0) - - 39.0 (34.5-47.2) - - - - -
Age (N = 190)
16.0-31.6 - 47 24.7 - 39 26.9 - 8 17.8 - - -
31.7-37.2 - 47 24.7 - 39 26.9 - 8 17.8 1.00 0.34-2.93 1.000
37.3-44.5 - 49 25.8 - 32 22.1 - 17 37.8 2.59 0.99-6.78 0.052
44.6-74.5 - 47 25.8 - 35 24.1 - 12 26.7 1.67 0.61-4.56 0.316
Sex (N = 190)
Female - 175 92.1 - 134‡ 93.7‡ - 41‡ 72.7‡ - - -
Male - 15 7.9 - 11‡ 6.3‡ - 4‡ 27.3‡ 5.58‡ 1.24-25.19*‡ 0.025*‡
Table 2 continues on the next page →
http://www.sajhivmed.org.za 348 Open Access