
Page 223 - SAHCS HIVMed Journal Vol 20 No 1 2019
P. 223
Page 4 of 6 Original Research
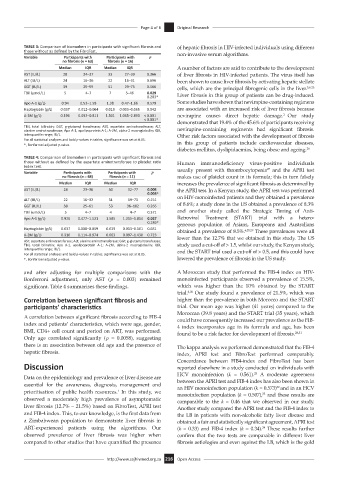
TABLE 3: Comparison of biomarkers in participants with significant fibrosis and of hepatic fibrosis in HIV-infected individuals using different
those without as defined by the FibroTest. non-invasive serum algorithms.
Variable Participants with Participants with p
no fibrosis (n = 63) fibrosis (n = 16)
Median IQR Median IQR A number of factors are said to contribute to the development
AST (IU/L) 28 24–37 33 27–39 0.366 of liver fibrosis in HIV-infected patients. The virus itself has
ALT (IU/L) 24 16–36 22 16–31 0.696 been shown to cause liver fibrosis by activating hepatic stellate
GGT (IU/L) 39 25–59 51 29–75 0.566 cells, which are the principal fibrogenic cells in the liver. 5,6,26
TBil (µmol/L) 5 4–7 7 5–46 0.029
0.203* Liver fibrosis in this group of patients can be drug-induced.
Apo A-1 (g/L) 0.94 0.53–1.58 1.38 0.47–1.66 0.579 Some studies have shown that nevirapine-containing regimens
Haptoglobin (g/L) 0.037 0.012–0.064 0.019 0.003–0.065 0.542 are associated with an increased risk of liver fibrosis because
A-2M (g/L) 0.196 0.092–0.811 1.501 1.065–2.893 < 0.001 nevirapine causes direct hepatic damage. Our study
2
< 0.001* demonstrated that 19.4% of the 45.6% of participants receiving
TBil, total bilirubin; GGT, g-glutamyl transferase; AST, aspartate aminotransferase; ALT,
alanine aminotransferase; Apo A-1, apolipoprotein A-1; A-2M, alpha-2 macroglobulin; IQR, nevirapine-containing regiments had significant fibrosis.
interquartile range; IU/L. Other risk factors associated with the development of fibrosis
For all statistical analyses and bold p-values in tables, significance was set at 0.05.
*, Bonferroni adjusted p-value. in this group of patients include cardiovascular diseases,
diabetes mellitus, dyslipidaemias, being obese and ageing. 26
TABLE 4: Comparison of biomarkers in participants with significant fibrosis and
those without as defined by the aspartate aminotransferase to platelet ratio Human immunodeficiency virus-positive individuals
index test. 27
Variable Participants with Participants with p usually present with thrombocytopenia and the APRI test
no fibrosis (n = 68) fibrosis (n = 11) makes use of platelet count in its formula; this in turn falsely
Median IQR Median IQR increases the prevalence of significant fibrosis as determined by
AST (IU/L) 28 23–36 50 32–77 0.005 the APRI test. In a Kenyan study, the APRI test was performed
0.003*
ALT (IU/L) 22 16–32 31 19–73 0.151 on HIV-monoinfected patients and they obtained a prevalence
GGT (IU/L) 38 25–61 53 36–102 0.266 of 8.6%; a study done in the US obtained a prevalence of 8.3%
TBil (umol/L) 5 4–7 4 4–7 0.371 and another study called the Strategic Timing of Anti-
Apo A-1 (g/L) 0.926 0.477–1.521 1.585 1.215–1.814 0.027 Retroviral Treatment (START) trial with a hetero-
0.186* geneous population of Asians, Europeans and Australians
Haptoglobin (g/L) 0.037 0.008–0.059 0.039 0.013–0.101 0.681 obtained a prevalence of 8.5%. 6,28,29 These prevalences were all
A-2M (g/L) 0.310 0.114–0.974 0.663 0.097–1.430 0.723 lower than the 12.7% that we obtained in this study. The US
AST, aspartate aminotransferase; ALT, alanine aminotransferase; GGT, g-glutamyl transferase;
TBil, total bilirubin; Apo A-1, apolipoprotein A-1; A-2M, alpha-2 macroglobulin; IQR, study used a cut-off of > 1.5, whilst our study, the Kenyan study,
interquartile range; IU/L. and the START trial used a cut-off of > 0.5, and this could have
For all statistical analyses and bold p-values in tables, significance was set at 0.05.
*, Bonferroni adjusted p-value. lowered the prevalence of fibrosis in the US study.
and after adjusting for multiple comparisons with the A Moroccan study that performed the FIB-4 index on HIV-
Bonferroni adjustment, only AST ( p = 0.003) remained monoinfected participants observed a prevalence of 15.5%,
significant. Table 4 summarises these findings. which was higher than the 10% obtained by the START
trial. 6,30 Our study found a prevalence of 21.5%, which was
Correlation between significant fibrosis and higher than the prevalence in both Morocco and the START
participants’ characteristics trial. Our mean age was higher (41 years) compared to the
Moroccan (39.8 years) and the START trial (35 years), which
A correlation between significant fibrosis according to FIB-4 could have consequently increased our prevalence as the FIB-
index and patients’ characteristics, which were age, gender, 4 index incorporates age in its formula and age, has been
BMI, CD4+ cell count and period on ART, was performed. found to be a risk factor for development of fibrosis. 28,31
Only age correlated significantly ( p = 0.0058), suggesting
there is an association between old age and the presence of The kappa analysis we performed demonstrated that the FIB-4
hepatic fibrosis. index, APRI test and FibroTest performed comparably.
Concordance between FIB4-index and FibroTest has been
Discussion reported elsewhere in a study conducted on individuals with
HCV monoinfection (k = 0.561). A moderate agreement
25
Data on the epidemiology and prevalence of liver disease are
essential for the awareness, diagnosis, management and between the APRI test and FIB-4 index has also been shown in
an HIV monoinfection population (k = 0.573) and in an HCV
32
prioritisation of public health resources. In this study, we monoinfection population (k = 0.507), and these results are
1
33
observed a moderately high prevalence of asymptomatic comparable to the k = 0.46 that we observed in our study.
liver fibrosis (12.7% – 21.5%) based on FibroTest, APRI test Another study compared the APRI test and the FIB-4 index to
and FIB-4 index. This, to our knowledge, is the first data from the LB in patients with non-alcoholic fatty liver disease and
a Zimbabwean population to demonstrate liver fibrosis in obtained a fair and statistically significant agreement, APRI test
ART-experienced patients using the algorithms. Our (k = 0.33) and FIB-4 index (k = 0.34). These results further
34
observed prevalence of liver fibrosis was higher when confirm that the two tests are comparable in different liver
compared to other studies that have quantified the presence fibrosis aetiologies and even against the LB, which is the gold
http://www.sajhivmed.org.za 216 Open Access