
Page 222 - SAHCS HIVMed Journal Vol 20 No 1 2019
P. 222
Page 3 of 6 Original Research
These values have been reported to be predictive of significant participants receiving nevirapine-containing ART regimens
hepatic fibrosis and were adopted for this study. 10,23,24,25 had significant fibrosis based on the FibroTest, which has
All statistical analyses were performed using Stata 13.0 (Stata been validated in other settings. 19,20 One of the three
Corp., College Station, Texas, USA) software package and a participants co-infected with HBV had significant fibrosis as
p-value of < 0.05 was considered statistically significant. determined by the FibroTest. When we performed the test for
agreement among the non-invasive algorithms, there was a
Ethical consideration moderate agreement between FIB-4 index and APRI test
(k = 0.46), fair agreement between (1) FibroTest and FIB-4
The study protocol was approved by the Joint Parirenyatwa
Hospital and College of Health Sciences Research Ethics index (k = 0.40) and (2) between FibroTest and APRI test
Committee (JREC Ref: 45/14). All participants gave written (k = 0.25). The AST:ALT ratio was in poor agreement with all
informed patient consent or assent. Consent was granted by three other algorithms: FibroTest (k = 0.08), FIB-4 index
parents or guardians in the case of minors. (k = 0.10) and APRI test (k = 0.08).
Results Individual biomarkers in fibrosis and non-
Characteristics of the study population fibrosis as defined by FibroTest
We compared individual serum biomarkers between
We enrolled 79 HIV-infected individuals with mean age and participants with significant fibrosis and those without
standard deviation (s.d.) of 41 and 11 years, respectively. The as defined by FibroTest. Total bilirubin and A-2M
majority of participants (65.8%; n = 55) were female and the
average body mass index (BMI) was 23 kg/m , with 14.7% concentrations were significantly elevated in participants
2
being underweight, 61.8% being normal weight, 14.7% being with fibrosis, median (IQR) 7 μmol/L (5–46) versus 5
overweight and 8.8% being obese. Seventy-six per cent of the μmol/L (4–7) ( p = 0.029) and 1.5 g/L (1.1–2.9) versus 0.2 g/L
participants were on nucleoside reverse transcriptase (0.1–0.8) ( p < 0.001), respectively, when compared to those
inhibitor (NRTI) plus non-nucleoside reverse transcriptase without fibrosis. However, after adjusting for multiple
inhibitors (NNRTI), 17.7% were taking NRTIs plus protease comparisons with the Bonferroni adjustment, only A-2M
inhibitor (PI) whilst 6.3% were taking NRTIs only. The ( p < 0.001) remained significant. The findings are
duration on ART ranged from 1 to 13 years with a median of summarised in Table 3.
four years and six months and interquartile range (IQR) of
2–7 years. Based on serological tests, 3.8% (n = 3) of study Individual biomarkers in fibrosis and non-
participants had HIV/HBV co-infection. The demographic fibrosis defined by aspartate aminotransferase
characteristics of the study participants are shown in Table 2. to platelet ratio index test
Utility of algorithms for the prediction of We further compared individual serum biomarkers based on
hepatic fibrosis APRI test strata. Aspartate aminotransferase and Apo A-1
were significantly elevated in participants with fibrosis
We first determined the prevalence of fibrosis in our study median (IQR) 50 (32–77) IU/L versus 28 (23–36) IU/L
participants using each of the four algorithms (FibroTest, ( p = 0.005) and 1.6 (1.2–1.8) g/L versus 0.9 (0.5–1.5) g/L
FIB-4 index, APRI test and AST:ALT ratio). The prevalence of ( p = 0.027), respectively, when compared to those without
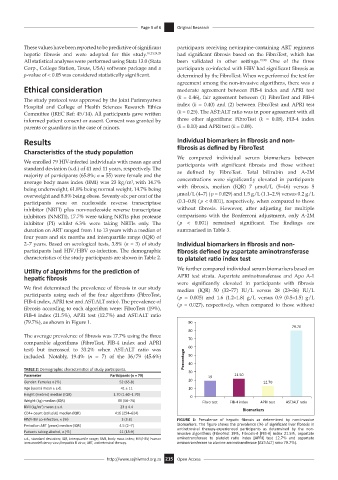
fibrosis according to each algorithm were: FibroTest (19%),
FIB-4 index (21.5%), APRI test (12.7%) and AST:ALT ratio
(79.7%), as shown in Figure 1. 90
79.70
80
The average prevalence of fibrosis was 17.7% using the three 70
comparable algorithms (FibroTest, FIB-4 index and APRI
test) but increased to 33.2% when AST:ALT ratio was 60
included. Notably, 19.4% (n = 7) of the 36/79 (45.6%) Percentage 50
TABLE 2: Demographic characteristics of study participants. 40
30
Parameter Participants (n = 79) 19 21.50
Gender: Females n (%) 52 (65.8) 20 12.70
Age (years) mean ± s.d. 41 ± 11 10
Height (metres) median (IQR) 1.70 (1.60–1.70) 0
Weight (kg) median (IQR) 66 (56–75) Fibro test FIB-4 index APRI test AST/ALT rao
BMI (kg/m ) mean ± s.d. 23 ± 4.4 Biomarkers
2
CD4+ count (cells/uL) median (IQR) 416 (254–624)
HIV/HBV co-infection, n (%) 3 (3.8) FIGURE 1: Prevalence of hepatic fibrosis as determined by non-invasive
Period on ART (years) median (IQR) 4.5 (2–7) biomarkers. The figure shows the prevalence (%) of significant liver fibrosis in
antiretroviral therapy-experienced participants as determined by the non-
Patients taking alcohol, n (%) 11 (13.9) invasive algorithms (FibroTest 19%, Fibrosis-4 [FIB-4] index 21.5%, aspartate
s.d., standard deviation; IQR, interquartile range; BMI, body mass index; HIV/HBV, human aminotransferase to platelet ratio index [APRI] test 12.7% and aspartate
immunodeficiency virus/hepatitis B virus; ART, antiretroviral therapy. aminotransferase to alanine aminotransferase [AST:ALT] ratio 79.7%).
http://www.sajhivmed.org.za 215 Open Access