
Page 228 - SAHCS HIVMed Journal Vol 20 No 1 2019
P. 228
Page 3 of 6 Original Research
TABLE 1: Baseline demographics of the subset compared to the total cohort.
Variable Cohort Subset p
n % mean s.d. Median IQR n % mean s.d. Median IQR
Number 230 - - - - - 135 - - - - - -
Female sex 150 65.2 - - - - 125 92.6 - - - - < 0.0001
Age (years) - - 34.5 9.1 - - - - 33.7 8.9 - - 0.338
Weight (kg) 69 - 69 15.1 - - - - 71.6 15.1 - - 0.312
Height (cm) - - 164 8.6 - - - - 161.2 7 - - 0.019
CD4 count (cells/mm ) 3 - - - - 225.5 131.5–287 - - - - 234.5 152.5–290.5 0.266
Log HIV RNA (copies/mL) - - - - 4.9 4.4–5.4 - - - - 4.7 4.4–5.3 0.114
s.d., standard deviation; IQR, interquartile range; HIV, human immunodeficiency virus; RNA, ribonucleic acid.
Results TABLE 2: Cumulative electronic adherence monitoring device adherence at
weeks 16 and 48 for the cohort and subset.
Baseline characteristics Variable Week 16 Week 48
Adherence % Adherence %
Of the 230 individuals enrolled in the parent study, 135 n Median IQR n Median IQR
individuals provided hair samples. The majority, 92.6%, of Cohort 19 160 93 74–98 180 86 59–94
this subset cohort were Black African females. A total of 257 Subset 93 100 92–100 89 101 96–107
hair samples were collected from the 135 individuals, EAMD, electronic adherence monitoring device; IQR, interquartile range.
consisting of 93 at week 16, 75 at week 32 and 89 at week 48.
On average, two hair samples were collected from each of the
individuals who participated in the sub-study. A comparison 50
of the baseline demographics for the cohort and the subset is 45
detailed in Table 1. 40
Cohort and subset adherence 35
High levels of adherence were observed in the subset. The Hair EFV concentra on (ng/mg) 30
median adherence of the subset was higher at weeks 16 and 25
48 compared to that of the cohort. Of the 230 individuals 20
enrolled in the parent study, only 160 individuals returned
for the week 16 visit, for blood sampling, and only 180 at 15
week 48. These individuals provide the adherence comparison 10
for the subset with hair samples (Table 2).
5
Few individuals enrolled in the subset displayed virologic 0
failure: at week 16, 4 out of 93 (4.3%) individuals had Extensive Intermediate Slow
viral loads greater than 400 copies/mL, and at week 48, Metaboliser status
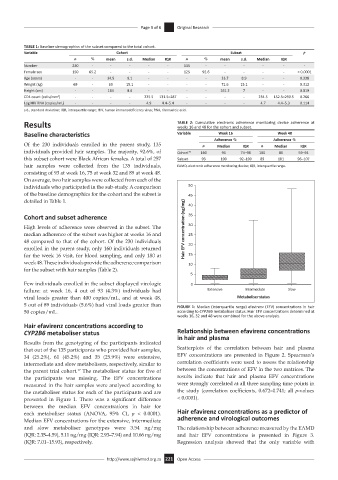
5 out of 89 individuals (5.6%) had viral loads greater than FIGURE 1: Median (interquartile range) efavirenz (EFV) concentrations in hair
50 copies/mL. according to CYP2B6 metaboliser status. Hair EFV concentrations determined at
weeks 16, 32 and 48 were combined for the above analysis.
Hair efavirenz concentrations according to
CYP2B6 metaboliser status Relationship between efavirenz concentrations
in hair and plasma
Results from the genotyping of the participants indicated
that out of the 135 participants who provided hair samples, Scatterplots of the correlation between hair and plasma
34 (25.2%), 61 (45.2%) and 35 (25.9%) were extensive, EFV concentrations are presented in Figure 2. Spearman’s
intermediate and slow metabolisers, respectively, similar to correlation coefficients were used to assess the relationship
the parent trial cohort. The metaboliser status for five of between the concentrations of EFV in the two matrices. The
17
the participants was missing. The EFV concentrations results indicate that hair and plasma EFV concentrations
measured in the hair samples were analysed according to were strongly correlated at all three sampling time points in
the metaboliser status for each of the participants and are the study (correlation coefficients, 0.672–0.741; all p-values
presented in Figure 1. There was a significant difference < 0.0001).
between the median EFV concentrations in hair for
each metaboliser status (ANOVA, 95% CI, p < 0.0001). Hair efavirenz concentrations as a predictor of
Median EFV concentrations for the extensive, intermediate adherence and virological outcomes
and slow metaboliser genotypes were 3.54 ng/mg The relationship between adherence measured by the EAMD
(IQR: 2.35–4.59), 5.11 ng/mg (IQR: 2.93–7.94) and 10.66 ng/mg and hair EFV concentrations is presented in Figure 3.
(IQR: 7.01–15.93), respectively. Regression analysis showed that the only variable with
http://www.sajhivmed.org.za 221 Open Access