
Page 348 - SAHCS HIVMed Journal Vol 20 No 1 2019
P. 348
Page 5 of 8 Original Research
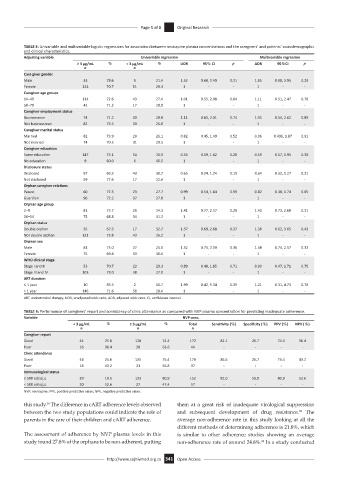
TABLE 3: Univariable and multivariable logistic regressions for association between nevirapine plasma concentrations and the caregivers’ and patients’ sociodemographic
and clinical characteristics.
Adjusting variable Univariable regression Multivariable regression
≥ 3 µg/mL % < 3 µg/mL % UOR 95% CI p AOR 95%CI p
n n
Care giver gender
Male 33 78.6 9 21.4 1.52 0.68, 3.40 0.31 1.65 0.68, 3.95 0.29
Female 123 70.7 51 29.3 1 - - 1 - -
Caregiver age groups
14–49 114 72.6 43 27.4 1.01 0.55, 2.08 0.84 1.11 0.51, 2.47 0.78
50–79 42 71.2 17 28.8 1 - - 1 - -
Caregiver employment status
Businessman 74 71.2 30 28.8 1.11 0.61, 2.01 0.74 1.05 0.54, 2.02 0.89
Not businessman 82 73.2 30 26.8 1 - - 1 - -
Caregiver marital status
Married 82 73.9 29 26.1 0.82 0.45, 1.49 0.52 0.96 0.496, 1.87 0.91
Not married 74 70.5 31 29.5 1 - - 1 - -
Caregiver education
Some education 147 73.1 54 26.9 0.55 0.19, 1.62 0.28 0.58 0.17, 1.95 0.38
No education 9 60.0 6 40.0 1 - - 1 - -
Disclosure status
Disclosed 97 69.3 43 30.7 0.65 0.34, 1.24 0.19 0.64 0.32, 1.27 0.21
Not disclosed 59 77.6 17 22.4 1 - - 1 - -
Orphan caregiver relations
Parent 60 72.3 23 27.7 0.99 0.54, 1.84 0.99 0.82 0.38, 1.74 0.65
Guardian 96 72.2 37 27.8 1 - - 1 - -
Orphan age group
2–9 81 75.7 26 24.3 1.41 0.77, 2.57 0.26 1.40 0.73, 2.68 0.31
10–14 75 68.8 34 31.2 1 - - 1 - -
Orphan status
Double orphan 35 67.3 17 32.7 1.37 0.69, 2.68 0.37 1.38 0.62, 3.05 0.43
Not double orphan 121 73.8 43 26.2 1 - - 1 - -
Orphan sex
Male 81 75.0 27 25.0 1.32 0.73, 2.39 0.36 1.38 0.74, 2.57 0.32
Female 75 69.4 33 30.6 1 - - 1 - -
WHO clinical stage
Stage I and II 53 70.7 22 29.3 0.89 0.48, 1.65 0.71 0.90 0.47, 1.71 0.75
Stage III and IV 103 73.0 38 27.0 1 - - 1 - -
ART duration
≤ 1 year 10 83.3 2 16.7 1.99 0.42, 9.34 0.39 1.21 0.31, 4.73 0.78
> 1 year 146 71.6 58 28.4 1 - - 1 - -
ART, antiretroviral therapy; UOR, unadjusted odds ratio; AOR, adjusted odds ratio; CI, confidence interval.
TABLE 4: Performance of caregivers’ report and consistency of clinic attendance as compared with NVP plasma concentration for predicting inadequate adherence.
Variable NVP conc.
< 3 µg/mL % ≥ 3 µg/mL % Total Sensitivity (%) Specificity (%) PPV (%) NPV (%)
n n n
Caregiver report
Good 44 25.6 128 74.4 172 82.1 26.7 74.4 36.4
Poor 16 36.4 28 63.6 44 - - - -
Clinic attendance
Good 44 24.6 135 75.4 179 86.5 26.7 75.4 43.2
Poor 16 43.2 21 56.8 37 - - - -
Immunological status
≥ 500 cells/μL 29 19.1 123 80.9 152 82.0 50.8 80.9 52.6
< 500 cells/μL 30 52.6 27 47.4 57 - - - -
NVP, nevirapine; PPV, positive predictive value; NPV, negative predictive value.
this study. The difference in cART adherence levels observed them at a great risk of inadequate virological suppression
16
32
between the two study populations could indicate the role of and subsequent development of drug resistance. The
parents in the care of their children and cART adherence. average non-adherence rate in this study looking at all the
different methods of determining adherence is 21.8%, which
The assessment of adherence by NVP plasma levels in this is similar to other adherence studies showing an average
study found 27.8% of the orphans to be non-adherent, putting non-adherence rate of around 24.8%. In a study conducted
33
http://www.sajhivmed.org.za 341 Open Access