Page 373 - HIVMED_v21_i1.indb
P. 373
Page 3 of 5  Original Research


              Data collection                                       Results

              A list of all the participants and their folder numbers was   We reviewed 1468 patient folders. The pre-implementation
              generated from the Tier.net database. Files were retrieved   dataset excluded 387 patients that were lost to follow-up, 209
              from the filing room according to the list, file audits were   patients that were transferred out and 24 patients that died.
              performed, and data were entered in the data collection   The final number of patients included for analysis was 850
              Microsoft Excel spreadsheet. Duplication of patients’ records,   in the pre-implementation group. The post-implementation
              patients transferred out to other sites, patients lost to follow   dataset excluded 38 patients that turned 19 before the end of
              up, and deceased patients were removed from the database.  the audit, 24 patients that were lost to follow-up and 23
                                                                    patients that were transferred out. We ended up with 765
              HIV VL testing was assessed by presence of results on the   patients in the post-implementation group.
              results sheet in the patient’s chart or the result log in
              the clinical chart or a specimen lab sticker in the file, or the   Baseline characteristics
              note of the doctor’s order for the test. VL results that were
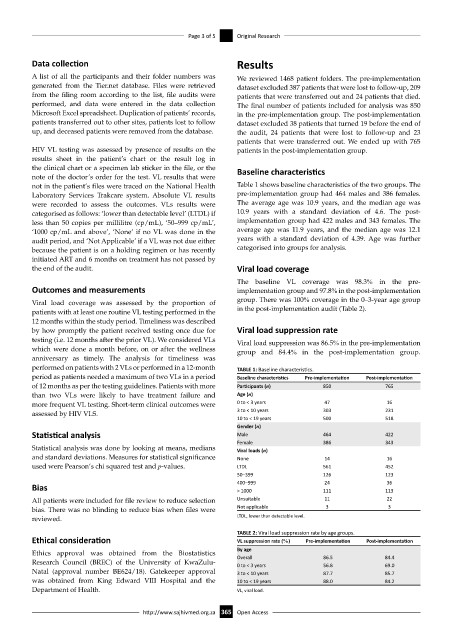
              not in the patient’s files were traced on the National Health   Table 1 shows baseline characteristics of the two groups. The
              Laboratory Services Trakcare system.  Absolute VL results   pre-implementation group had 464 males and 386 females.
              were recorded to assess the outcomes. VLs results were   The average age was 10.9 years, and the median age was
              categorised as follows: ‘lower than detectable level’ (LTDL) if   10.9  years with a standard deviation of 4.6. The post-
              less than 50 copies per millilitre (cp/mL), ‘50–999 cp/mL’,   implementation group had 422 males and 343 females. The
              ‘1000 cp/mL and above’, ‘None’ if no VL was done in the   average age was 11.9 years, and the median age was 12.1
              audit period, and ‘Not Applicable’ if a VL was not due either   years with a standard deviation of 4.39.  Age was further
              because the patient is on a holding regimen or has recently   categorised into groups for analysis.
              initiated ART and 6 months on treatment has not passed by
              the end of the audit.                                 Viral load coverage
                                                                    The baseline VL coverage was 98.3% in the pre-
              Outcomes and measurements                             implementation group and 97.8% in the post-implementation

              Viral load coverage was assessed by the proportion of   group. There was 100% coverage in the 0–3-year age group
              patients with at least one routine VL testing performed in the   in the post-implementation audit (Table 2).
              12 months within the study period. Timeliness was described
              by how promptly the patient received testing once due for   Viral load suppression rate
              testing (i.e. 12 months after the prior VL). We considered VLs   Viral load suppression was 86.5% in the pre-implementation
              which were done a month before, on or after the wellness   group and 84.4% in the post-implementation group.
              anniversary as timely. The analysis for timeliness was
              performed on patients with 2 VLs or performed in a 12-month   TABLE 1: Baseline characteristics.
              period as patients needed a maximum of two VLs in a period   Baseline characteristics  Pre-implementation  Post-implementation
              of 12 months as per the testing guidelines. Patients with more   Participants (n)  850       765
              than two VLs were likely to have treatment failure and   Age (n)
              more frequent VL testing. Short-term clinical outcomes were   0 to < 3 years   47            16
              assessed by HIV VLS.                                  3 to < 10 years       303              231
                                                                    10 to < 19 years      500              518
                                                                    Gender (n)
              Statistical analysis                                  Male                  464              422
                                                                    Female                386              343
              Statistical analysis was done by looking at means, medians   Viral loads (n)
              and standard deviations. Measures for statistical significance   None        14              16
              used were Pearson’s chi squared test and p-values.    LTDL                  561              452
                                                                    50–399                126              123
                                                                                           24
                                                                                                           36
              Bias                                                  400–999               111              113
                                                                    > 1000
              All patients were included for file review to reduce selection   Unsuitable  11              22
              bias. There was no blinding to reduce bias when files were   Not applicable  3               3
              reviewed.                                             LTDL, lower than detectable level.

                                                                    TABLE 2: Viral load suppression rate by age groups.
              Ethical consideration                                 VL suppression rate (%)  Pre-implementation  Post-implementation
                                                                    By age
              Ethics approval was obtained from the Biostatistics   Overall               86.5            84.4
              Research  Council (BREC) of the University of KwaZulu-  0 to < 3 years      56.8            69.0
              Natal (approval number BE624/18). Gatekeeper approval   3 to < 10 years     87.7            85.7
              was obtained from King Edward VIII Hospital and the   10 to < 19 years      88.0            84.2
              Department of Health.                                 VL, viral load.

                                           http://www.sajhivmed.org.za 365  Open Access

