
Page 350 - HIVMED_v21_i1.indb
P. 350
Page 4 of 7 Original Research
decentralised, and more facilities started providing antenatal
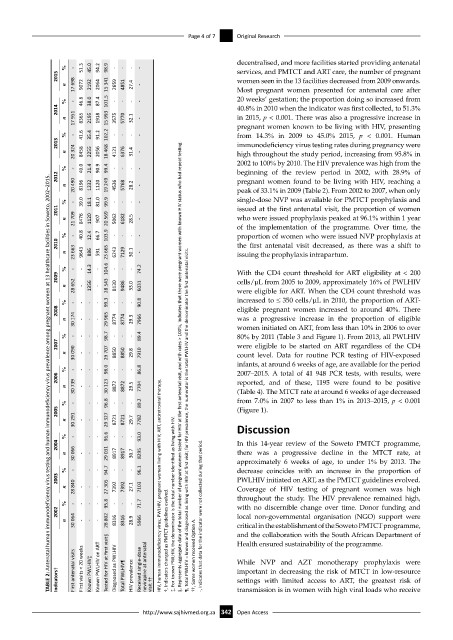
% - 51.3 45.0 94.2 98.9 - - - - services, and PMTCT and ART care, the number of pregnant
2015 women seen in the 13 facilities decreased from 2009 onwards.
n 17 698 9072 2192 2064 15 341 2659 4851 27.4 - Most pregnant women presented for antenatal care after
% - 46.6 38.0 87.4 101.5 - - - - 20 weeks’ gestation; the proportion doing so increased from
2014 40.8% in 2010 when the indicator was first collected, to 51.3%
n 17 951 8365 2195 1918 15 993 3575 5770 32.1 - in 2015, p < 0.001. There was also a progressive increase in
pregnant women known to be living with HIV, presenting
% - 41.6 35.4 91.2 102.2 - - - - from 14.3% in 2009 to 45.0% 2015, p < 0.001. Human
2013 immunodeficiency virus testing rates during pregnancy were
n 20 324 8458 2255 2056 18 468 4121 6376 31.4 - high throughout the study period, increasing from 95.8% in
2002 to 100% by 2010. The HIV prevalence was high from the
% - 40.0 21.4 90.9 99.4 - - - - beginning of the review period in 2002, with 28.9% of
2012 pregnant women found to be living with HIV, reaching a
TABLE 2: Antenatal human immunodeficiency virus testing and human immunodeficiency virus prevalence among pregnant women at 13 healthcare facilities in Soweto, 2002–2015.
n 20 490 8196 1232 1120 19 249 4536 5768 28.2 - peak of 33.1% in 2009 (Table 2). From 2002 to 2007, when only
% - 39.0 18.1 81.0 99.9 - - - - single-dose NVP was available for PMTCT prophylaxis and
2011 issued at the first antenatal visit, the proportion of women
n 21 709 8476 1120 907 20 569 5062 6182 28.5 - who were issued prophylaxis peaked at 96.1% within 1 year
of the implementation of the programme. Over time, the
% - 40.8 12.4 66.7 103.9 - - - - proportion of women who were issued NVP prophylaxis at
2010 the first antenatal visit decreased, as there was a shift to
n 23 663 9643 886 591 23 665 6243 7129 30.1 - issuing the prophylaxis intrapartum.
% - - 14.3 - 104.6 - - - 74.2 With the CD4 count threshold for ART eligibility at < 200
2009 cells/µL from 2005 to 2009, approximately 16% of PWLHIV
n 28 652 - 1356 - 28 543 8130 9486 33.0 6031 were eligible for ART. When the CD4 count threshold was
% - - - - 99.3 - - - 90.8 increased to ≤ 350 cells/µL in 2010, the proportion of ART-
2008 eligible pregnant women increased to around 40%. There
n 30 174 - - - 29 965 8774 8774 29.3 7966 was a progressive increase in the proportion of eligible
women initiated on ART, from less than 10% in 2006 to over
% - - - - 98.7 - - - 89.4 80% by 2011 (Table 3 and Figure 1). From 2013, all PWLHIV
2007 were eligible to be started on ART regardless of the CD4
n 30 090 - - - 29 707 8850 8850 29.8 7910 count level. Data for routine PCR testing of HIV-exposed
infants, at around 6 weeks of age, are available for the period
% - - - - 98.0 - - - 86.8 §, Represents aggregate data of the total number of pregnant women tested for HIV at the first antenatal visit, and with rates > 100%, indicates that there were pregnant women with known HIV status who had repeat testing. 2007–2015. A total of 41 948 PCR tests, with results, were
2006 reported, and of these, 1195 were found to be positive
n 30 739 - - - 30 123 8872 8872 29.5 7704 (Table 4). The MTCT rate at around 6 weeks of age decreased
% - - - 96.8 - - - 89.2 from 7.0% in 2007 to less than 1% in 2013–2015, p < 0.001
2005 (Figure 1).
n 30 291 - - - 29 327 8721 8721 29.7 7782 ¶, Total PWLHIV = known and diagnosed as living with HIV at first visit; for HIV prevalence, the numerator is the total PWLHIV and the denominator the first antenatal visits. Discussion
% - - - 96.6 - - - 93.0
2004 In this 14-year review of the Soweto PMTCT programme,
n 30 066 - - - 29 031 8917 8917 30.7 8295 there was a progressive decline in the MTCT rate, at
approximately 6 weeks of age, to under 1% by 2013. The
% - - - 94.7 - - - 96.1 decrease coincides with an increase in the proportion of
2003 PWLHIV initiated on ART, as the PMTCT guidelines evolved.
n 28 840 - - - 27 305 7392 7392 27.1 7103 HIV, human immunodeficiency virus; PWLHIV, pregnant women living with HIV; ART, antiretroviral therapy. Coverage of HIV testing of pregnant women was high
% - - - - 95.8 - - - 71.7 ‡, For known PWLHIV, the denominator is the total number identified as living with HIV. throughout the study. The HIV prevalence remained high,
with no discernible change over time. Donor funding and
2002 -, Indicates that data for the indicator were not collected during that period. local non-governmental organisation (NGO) support were
n 30 064 - - - 28 802 8316 8316 28.9 5966 †, Indicators changed as PMTCT guidelines evolved. critical in the establishment of the Soweto PMTCT programme,
and the collaboration with the South African Department of
Health ensured sustainability of the programme.
important in decreasing the risk of MTCT in low-resource
Indicators† First antenatal visits First visits < 20 weeks Known PWLHIV‡ Known PWLHIV on ART Tested for HIV at first visit§ Diagnosed as PWLHIV Total PWLHIV¶ HIV prevalence Received single-dose nevirapine at antenatal visit †† ††, Some women received Option A. While NVP and AZT monotherapy prophylaxis were
settings with limited access to ART, the greatest risk of
transmission is in women with high viral loads who receive
http://www.sajhivmed.org.za 342 Open Access