
Page 325 - HIVMED_v21_i1.indb
P. 325
Page 4 of 8 Original Research
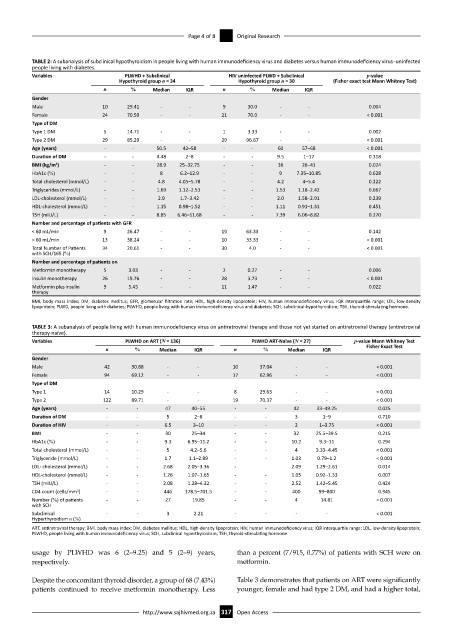
TABLE 2: A subanalysis of subclinical hypothyroidism in people living with human immunodeficiency virus and diabetes versus human immunodeficiency virus–uninfected
people living with diabetes.
Variables PLWHD + Subclinical HIV uninfected PLWD + Subclinical p-value
Hypothyroid group n = 34 Hypothyroid group n = 30 (Fisher exact test Mann Whitney Test)
n % Median IQR n % Median IQR
Gender
Male 10 29.41 - - 9 30.0 - - 0.004
Female 24 70.59 - - 21 70.0 - - < 0.001
Type of DM
Type 1 DM 5 14.71 - - 1 3.33 - - 0.002
Type 2 DM 29 85.29 - - 29 96.67 - - < 0.001
Age (years) - - 50.5 42–58 - - 60 57–68 < 0.001
Duration of DM - - 4.48 2–8 - - 9.5 1–17 0.318
BMI (kg/m ) 2 - - 28.9 25–32.75 - - 36 26–41 0.024
HbA1c (%) - - 8 6.2–12.9 - - 9 7.35–10.85 0.628
Total cholesterol (mmol/L) - - 4.8 4.05–5.78 - - 4.2 4–5.4 0.222
Triglycerides (mmol/L) - - 1.69 1.12–2.53 - - 1.53 1.18–2.42 0.667
LDL-cholesterol (mmol/L) - - 2.9 1.7–3.42 - - 2.0 1.58–2.91 0.239
HDL-cholesterol (mmol/L) - - 1.15 0.98–1.52 - - 1.11 0.91–1.31 0.451
TSH (mIU/L) - - 8.85 6.46–11.68 - - 7.39 6.06–8.82 0.270
Number and percentage of patients with GFR
< 60 mL/min 9 26.47 - - 19 63.33 - - 0.142
> 60 mL/min 13 38.24 - - 10 33.33 - - < 0.001
Total Number of Patients 34 20.61 - - 30 4.0 - - < 0.001
with SCH/165 (%)
Number and percentage of patients on
Metformin monotherapy 5 3.03 - - 2 0.27 - - 0.006
Insulin monotherapy 26 15.76 - - 28 3.73 - - < 0.001
Metformin plus insulin 9 5.45 - - 11 1.47 - - 0.022
therapy
BMI, body mass index; DM, diabetes mellitus; GFR, glomerular filtration rate; HDL, high-density lipoprotein; HIV, human immunodeficiency virus; IQR interquartile range; LDL, low-density
lipoprotein; PLWD, people living with diabetes; PLWHD, people living with human immunodeficiency virus and diabetes; SCH, subclinical-hypothyroidism; TSH, thyroid-stimulating hormone.
TABLE 3: A subanalysis of people living with human immunodeficiency virus on antiretroviral therapy and those not yet started on antiretroviral therapy (antiretroviral
therapy-naïve).
Variables PLWHD on ART (N = 136) PLWHD ART-Naïve (N = 27) p-value Mann Whitney Test
n % Median IQR n % Median IQR Fisher Exact Test
Gender
Male 42 30.88 - - 10 37.04 - - < 0.001
Female 94 69.12 - - 17 62.96 - - < 0.001
Type of DM
Type 1 14 10.29 - - 8 29.63 - - < 0.001
Type 2 122 89.71 - - 19 70.37 - - < 0.001
Age (years) - - 47 40–55 - - 42 33–49.25 0.025
Duration of DM - - 5 2–8 - - 3 1–9 0.710
Duration of HIV - - 6.5 3–10 - - 2 1–3.75 < 0.001
BMI - - 30 25–34 - - 32 25.5–39.5 0.215
HbA1c (%) - - 9.3 6.95–11.2 - - 10.2 9.3–11 0.294
Total cholesterol (mmol/L) - - 5 4.2–5.6 - - 4 3.33–4.45 < 0.001
Triglyceride (mmol/L) - - 1.7 1.1–2.89 - - 1.03 0.79–1.2 < 0.001
LDL- cholesterol (mmol/L) - - 2.68 2.05–3.36 - 2.09 1.29–2.61 0.014
HDL-cholesterol (mmol/L) - - 1.26 1.07–1.65 - - 1.05 0.92–1.33 0.007
TSH (mIU/L) - - 2.08 1.28–4.32 - - 2.52 1.42–5.45 0.424
CD4 count (cells/mm ) 3 - - 446 178.5–701.5 - - 400 99–800 0.945
Number (%) of patients - - 27 19.85 - - 4 14.81 < 0.001
with SCH
Subclinical - - 3 2.21 - - - - < 0.001
Hyperthyroidism n (%)
ART, antiretroviral therapy; BMI, body mass index; DM, diabetes mellitus; HDL, high-density lipoprotein; HIV, human immunodeficiency virus; IQR interquartile range; LDL, low-density lipoprotein;
PLWHD, people living with human immunodeficiency virus; SCH, subclinical hyperthyroidism; TSH, thyroid-stimulating hormone.
usage by PLWHD was 6 (2–9.25) and 5 (2–9) years, than a percent (7/915, 0.77%) of patients with SCH were on
respectively. metformin.
Despite the concomitant thyroid disorder, a group of 68 (7.43%) Table 3 demonstrates that patients on ART were significantly
patients continued to receive metformin monotherapy. Less younger, female and had type 2 DM, and had a higher total,
http://www.sajhivmed.org.za 317 Open Access