
Page 324 - HIVMED_v21_i1.indb
P. 324
Page 3 of 8 Original Research
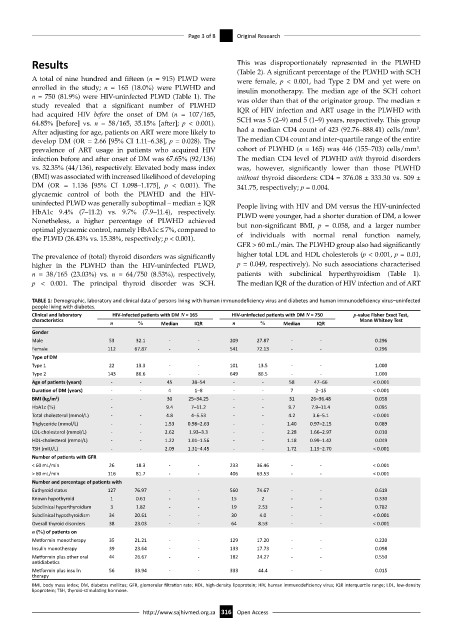
Results This was disproportionately represented in the PLWHD
(Table 2). A significant percentage of the PLWHD with SCH
A total of nine hundred and fifteen (n = 915) PLWD were were female, p < 0.001, had Type 2 DM and yet were on
enrolled in the study; n = 165 (18.0%) were PLWHD and insulin monotherapy. The median age of the SCH cohort
n = 750 (81.9%) were HIV-uninfected PLWD (Table 1). The was older than that of the originator group. The median ±
study revealed that a significant number of PLWHD IQR of HIV infection and ART usage in the PLWHD with
had acquired HIV before the onset of DM (n = 107/165,
64.85% [before] vs. n = 58/165, 35.15% [after]; p < 0.001). SCH was 5 (2–9) and 5 (1–9) years, respectively. This group
3
After adjusting for age, patients on ART were more likely to had a median CD4 count of 423 (92.76–888.41) cells/mm .
develop DM (OR = 2.66 [95% CI 1.11–6.38], p = 0.028). The The median CD4 count and inter-quartile range of the entire
3
prevalence of ART usage in patients who acquired HIV cohort of PLWHD (n = 165) was 446 (155–703) cells/mm .
infection before and after onset of DM was 67.65% (92/136) The median CD4 level of PLWHD with thyroid disorders
vs. 32.35% (44/136), respectively. Elevated body mass index was, however, significantly lower than those PLWHD
(BMI) was associated with increased likelihood of developing without thyroid disorders: CD4 = 376.08 ± 333.30 vs. 509 ±
DM (OR = 1.136 [95% CI 1.098–1.175], p < 0.001). The 341.75, respectively; p = 0.004.
glycaemic control of both the PLWHD and the HIV-
uninfected PLWD was generally suboptimal – median ± IQR People living with HIV and DM versus the HIV-uninfected
HbA1c 9.4% (7–11.2) vs. 9.7% (7.9–11.4), respectively. PLWD were younger, had a shorter duration of DM, a lower
Nonetheless, a higher percentage of PLWHD achieved
optimal glycaemic control, namely HbA1c ≤ 7%, compared to but non-significant BMI, p = 0.058, and a larger number
the PLWD (26.43% vs. 15.38%, respectively; p < 0.001). of individuals with normal renal function namely,
GFR > 60 mL/min. The PLWHD group also had significantly
The prevalence of (total) thyroid disorders was significantly higher total LDL and HDL cholesterols (p < 0.001, p = 0.01,
higher in the PLWHD than the HIV-uninfected PLWD, p = 0.049, respectively). No such associations characterised
n = 38/165 (23.03%) vs. n = 64/750 (8.53%), respectively, patients with subclinical hyperthyroidism (Table 1).
p < 0.001. The principal thyroid disorder was SCH. The median IQR of the duration of HIV infection and of ART
TABLE 1: Demographic, laboratory and clinical data of persons living with human immunodeficiency virus and diabetes and human immunodeficiency virus–uninfected
people living with diabetes.
Clinical and laboratory HIV-infected patients with DM N = 165 HIV-uninfected patients with DM N = 750 p-value Fisher Exact Test,
characteristics n % Median IQR n % Median IQR Mann Whitney Test
Gender
Male 53 32.1 - - 209 27.87 - - 0.296
Female 112 67.87 - - 541 72.13 - - 0.296
Type of DM
Type 1 22 13.3 - - 101 13.5 - - 1.000
Type 2 143 86.6 - - 649 86.5 - - 1.000
Age of patients (years) - - 45 38–54 - - 58 47–66 < 0.001
Duration of DM (years) - - 4 1–8 - - 7 2–15 < 0.001
BMI (kg/m ) 2 - - 30 25–34.25 - - 31 26–36.48 0.058
HbA1c (%) - 9.4 7–11.2 - - 9.7 7.9–11.4 0.095
Total cholesterol (mmol/L) - - 4.8 4–5.53 - - 4.2 3.6–5.1 < 0.001
Triglyceride (mmol/L) - - 1.53 0.98–2.63 - - 1.40 0.97–2.15 0.089
LDL-cholesterol (mmol/L) - - 2.62 1.93–3.3 - - 2.28 1.66–2.97 0.010
HDL-cholesterol (mmol/L) - - 1.22 1.01–1.56 - - 1.18 0.99–1.42 0.049
TSH (mIU/L) - - 2.09 1.31–4.45 - - 1.72 1.15–2.70 < 0.001
Number of patients with GFR
< 60 mL/min 26 18.3 - - 233 36.46 - - < 0.001
> 60 mL/min 116 81.7 - - 406 63.53 - - < 0.001
Number and percentage of patients with
Euthyroid status 127 76.97 - - 560 74.67 - - 0.619
Known hypothyroid 1 0.61 - - 15 2 - - 0.330
Subclinical hyperthyroidism 3 1.82 - - 19 2.53 - - 0.782
Subclinical hypothyroidism 34 20.61 - - 30 4.0 - - < 0.001
Overall thyroid disorders 38 23.03 - - 64 8.53 - - < 0.001
n (%) of patients on
Metformin monotherapy 35 21.21 - - 129 17.20 - - 0.220
Insulin monotherapy 39 23.64 - - 133 17.73 - - 0.098
Metformin plus other oral 44 26.67 - - 182 24.27 - - 0.550
antidiabetics
Metformin plus insulin 56 33.94 - - 333 44.4 - - 0.015
therapy
BMI, body mass index; DM, diabetes mellitus; GFR, glomerular filtration rate; HDL, high-density lipoprotein; HIV, human immunodeficiency virus; IQR interquartile range; LDL, low-density
lipoprotein; TSH, thyroid-stimulating hormone.
http://www.sajhivmed.org.za 316 Open Access