Page 310 - HIVMED_v21_i1.indb
P. 310

Page 4 of 8  Original Research


              During the follow-up period, three new diagnoses of DM   14.8% reported consistently getting antihypertensive
              were recorded in the case group, whereas four new diagnoses   medication for free at their local health centre during the
              of DM were recorded in the control group. Again, four new   study period. None of the cases and controls reported
              cases of HTN were diagnosed in the case group, and four   receiving free diabetic medication from a health facility
              new cases in the control arm. Other new diagnostic conditions   during the study period.
              recorded during the study were peptic (gastrointestinal tract)
              ulcers (four among cases and two among controls), asthma   Concerning the use of traditional medicines, more cases
              (two among cases and none among controls), arthritis (three   (83.4%) reported using traditional medicines for the treatment
              among cases and one among controls) and cataract (one   and management of ill health compared to the control group
              among cases and none among controls).                 (5.3%). Similarly, the majority (> 73.0%) reported using
                                                                    traditional medication for the management of DM and/or
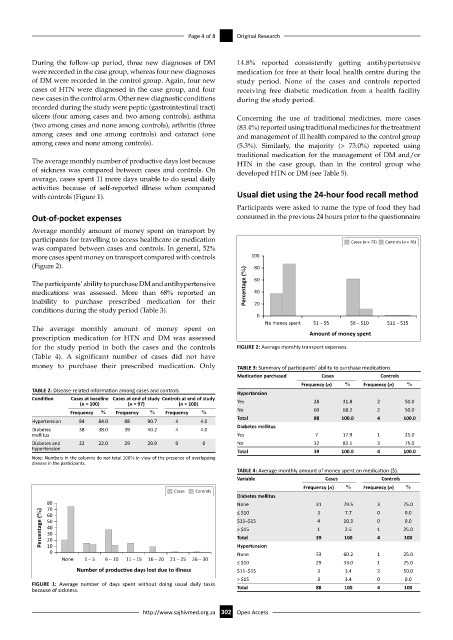
              The average monthly number of productive days lost because   HTN in the case group, than in the control group who
              of  sickness  was  compared  between  cases  and  controls.  On   developed HTN or DM (see Table 5).
              average, cases spent 11 more days unable to do usual daily
              activities  because of self-reported illness when compared
              with controls (Figure 1).                             Usual diet using the 24-hour food recall method
                                                                    Participants were asked to name the type of food they had
              Out-of-pocket expenses                                consumed in the previous 24 hours prior to the questionnaire
              Average monthly  amount of  money spent on  transport by
              participants for travelling to access healthcare or medication                      Cases (n = 73)  Controls (n = 76)
              was compared between cases and controls. In general, 52%
              more cases spent money on transport compared with controls   100
              (Figure 2).                                               80

              The participants’ ability to purchase DM and antihypertensive   Percentage (%)  60
              medications was assessed. More than 68% reported an       40
              inability to purchase prescribed medication for their     20
              conditions during the study period (Table 3).
                                                                         0
                                                                           No money spent  $1 – $5  $6 – $10  $11 – $15
              The average monthly amount of money spent on                             Amount of money spent
              prescription medication for HTN and DM was assessed
              for the study period in both the cases and the controls   FIGURE 2: Average monthly transport expenses.
              (Table 4).  A significant number of cases did not have
              money to purchase their prescribed medication. Only   TABLE 3: Summary of participants’ ability to purchase medications.
                                                                    Medication purchased  Cases          Controls
                                                                                    Frequency (n)   %  Frequency (n)   %
              TABLE 2: Disease-related information among cases and controls.  Hypertension
              Condition  Cases at baseline  Cases at end of study  Controls at end of study   Yes  28  31.8  2  50.0
                          (n = 100)    (n = 97)     (n = 100)
                        Frequency  %  Frequency  %  Frequency  %    No                  60     68.2     2       50.0
                                                                    Total               88     100.0    4      100.0
              Hypertension  84   84.0  88   90.7   4      4.0
              Diabetes    38   38.0   39    40.2   4      4.0       Diabetes mellitus
              mellitus                                              Yes                 7      17.9     1       25.0
              Diabetes and   22   22.0  29   29.9  0       0        No                  32     82.1     3       75.0
              hypertension
                                                                    Total               39     100.0    4      100.0
              Note: Numbers in the columns do not total 100% in view of the presence of overlapping
              disease in the participants.
                                                                    TABLE 4: Average monthly amount of money spent on medication ($).
                                                                    Variable               Cases          Controls
                                                                                     Frequency (n)  %  Frequency (n)  %
                                                   Cases  Controls
                                                                    Diabetes mellitus
                  80                                                None                31      79.5    3 0    75.0
                  70
                Percentage (%)  50                                  $11–$15             39      10.3    0 1 4  25.0
                                                                                                                0.0
                                                                                         3
                                                                    ≤ $10
                                                                                                7.7
                  60
                                                                                                                0.0
                                                                                         4
                  40
                                                                                         1
                                                                                                2.5
                                                                    > $15
                  30
                                                                                                               100
                                                                                                100
                                                                    Total
                  20
                  10
                  0                                                 Hypertension        53      60.2    1      25.0
                                                                    None
                      None  1 – 5  6 – 10  11 – 15  16 – 20  21 – 25  26 – 30
                                                                    ≤ $10               29      33.0    1      25.0
                         Number of produc ve days lost due to illness  $11–$15           3      3.4     2      50.0
                                                                    > $15                3      3.4     0       0.0
              FIGURE  1:  Average  number  of  days  spent  without  doing  usual  daily  tasks
              because of sickness.                                  Total               88      100     4      100
                                           http://www.sajhivmed.org.za 302  Open Access
   305   306   307   308   309   310   311   312   313   314   315