Page 267 - HIVMED_v21_i1.indb
P. 267

Page 3 of 8  Original Research


                                               %       47.20  52.80  2.10  47.70  52.30  0.22  1.88  1.79  1.81  56.31  36.45  1.53
                                             2015   843 972
                                               n       398 166   445 626   17 302   8250   9062   39   326   309   314   9742   6307   265


                                               %       46.77  53.23  1.90  47.20  52.80  0.18  2.06  1.92  1.75  54.79  37.80  1.51
                                             2014   838 617
                                               n       392 235   446 382   15 964   7537   8427   28   329   307   279   8745   6035   241


                                               %       46.89  53.11  2.10  49.90  50.10  0.20  2.11  1.54  1.79  55.37  37.58  1.43
                                             2013   809 833
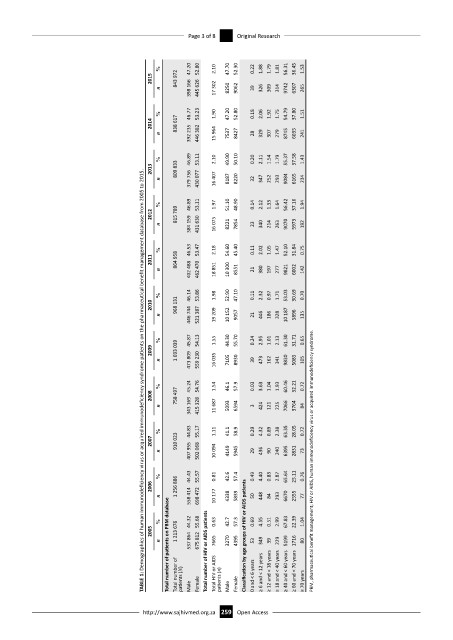
                                           TABLE 1: Demographics of human immunodeficiency virus or acquired immunodeficiency syndrome patients on the pharmaceutical benefit management database from 2005 to 2015.
                                               n       379 756   430 077   16 407   8187   8220   32   347   252   293   9084   6165   234


                                               %       46.89  53.11  1.97  51.10  48.90  0.14  2.12  1.33  1.64  56.42  37.16  1.94
                                             2012   815 789
                                               n       384 159   431 630   16 075   8221   7854   23   340   214   263   9070   5973   192


                                               %       46.53  53.47  2.18  54.60  45.40  0.11  2.02  1.05  1.47  52.10  31.84  0.75
                                             2011   864 958

                                               n       402 488   462 470   18 851   10 300   8551   21   380   197   277   9821   6002   142


                                               %       46.14  53.86  1.98  52.90  47.10  0.11  2.32  0.97  1.71  53.03  30.69  0.70
                                             2010   968 131
                                               n       446 744   521 387   19 209   10 152   9057   21   446   186   328   10 187   5896   135


                                               %       45.87  54.13  1.55  44.30  55.70  0.24  2.95  1.01  2.13  61.30  31.71  0.65
                                             2009   1 033 039

                                               n       473 809   559 230   16 035   7105   8930   39   473   162   341   9830   5085   105


                                               %       45.24  54.76  1.54  46.1  57.9  0.03  3.63  1.04  1.93  60.46  32.21  0.72
                                             2008   758 497
                                               n       343 169   415 328   11 687   5093   6594   3   424   121   225   7066   3764   84


                                               %       44.83  55.17  1.11  41.1  58.9  0.29  4.32  0.89  2.38  63.35  28.05  0.72
                                             2007   910 023
                                               n       407 955   502 068   10 094   4149   5945   29   436   90   240   6395   2831   73  PBM, pharmaceutical benefit management; HIV or AIDS, human immunodeficiency virus or acquired immunodeficiency syndrome.


                                               %       44.43  55.57  0.81  42.6  57.4  0.49  4.40  0.83  2.87  65.64  25.11  0.76
                                             2006   1 256 886
                                               n       558 414   698 472   10 177   4338   5839   50   448   84   293   6670   2555   77
                                                  Total number of patients on PBM database  Total number of   Total number of HIV or AIDS patients  Total HIV or AIDS   0 and < 6 years  ≥ 6 and < 12 years  ≥ 12 and < 18 years  ≥ 18 and < 40 years  ≥ 40 and < 60 years  ≥ 60 and < 70 years

                                               %       44.32  55.68  0.63  42.7  57.3  0.69  4.55  0.51  2.99  67.83  22.39  1.04
                                             2005   1 213 676         Classification by age groups of HIV or AIDS patients
                                               n       537 864  675 812  7665  3270  4395  53  349  39  229  5199  1716  80


                                                     patients (N)
                                                               patients (n)
                                                         Female
                                                       Male

                                           http://www.sajhivmed.org.za 259 Male  Female   Open Access  ≥ 70 years
   262   263   264   265   266   267   268   269   270   271   272