
Page 269 - HIVMED_v21_i1.indb
P. 269
Page 5 of 8 Original Research
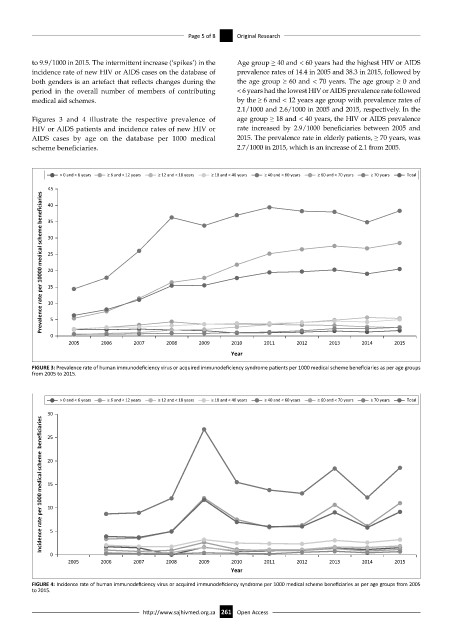
to 9.9/1000 in 2015. The intermittent increase (‘spikes’) in the Age group ≥ 40 and < 60 years had the highest HIV or AIDS
incidence rate of new HIV or AIDS cases on the database of prevalence rates of 14.4 in 2005 and 38.3 in 2015, followed by
both genders is an artefact that reflects changes during the the age group ≥ 60 and < 70 years. The age group ≥ 0 and
period in the overall number of members of contributing < 6 years had the lowest HIV or AIDS prevalence rate followed
medical aid schemes. by the ≥ 6 and < 12 years age group with prevalence rates of
2.1/1000 and 2.6/1000 in 2005 and 2015, respectively. In the
Figures 3 and 4 illustrate the respective prevalence of age group ≥ 18 and < 40 years, the HIV or AIDS prevalence
HIV or AIDS patients and incidence rates of new HIV or rate increased by 2.9/1000 beneficiaries between 2005 and
AIDS cases by age on the database per 1000 medical 2015. The prevalence rate in elderly patients, ≥ 70 years, was
scheme beneficiaries. 2.7/1000 in 2015, which is an increase of 2.1 from 2005.
> 0 and < 6 years ≥ 6 and < 12 years ≥ 12 and < 18 years ≥ 18 and < 40 years ≥ 40 and < 60 years ≥ 60 and < 70 years ≥ 70 years Total
45
Prevalence rate per 10000 medical scheme beneficiaries
40
35
30
25
20
15
10
5
0
2005 2006 2007 2008 2009 2010 2011 2012 2013 2014 2015
Year
FIGURE 3: Prevalence rate of human immunodeficiency virus or acquired immunodeficiency syndrome patients per 1000 medical scheme beneficiaries as per age groups
from 2005 to 2015.
> 0 and < 6 years ≥ 6 and < 12 years ≥ 12 and < 18 years ≥ 18 and < 40 years ≥ 40 and < 60 years ≥ 60 and < 70 years ≥ 70 years Total
30
Incidence rate per 1000 medical scheme beneficiaries
25
20
15
10
5
0
2005 2006 2007 2008 2009 2010 2011 2012 2013 2014 2015
Year
FIGURE 4: Incidence rate of human immunodeficiency virus or acquired immunodeficiency syndrome per 1000 medical scheme beneficiaries as per age groups from 2005
to 2015.
http://www.sajhivmed.org.za 261 Open Access