
Page 268 - HIVMED_v21_i1.indb
P. 268
Page 4 of 8 Original Research
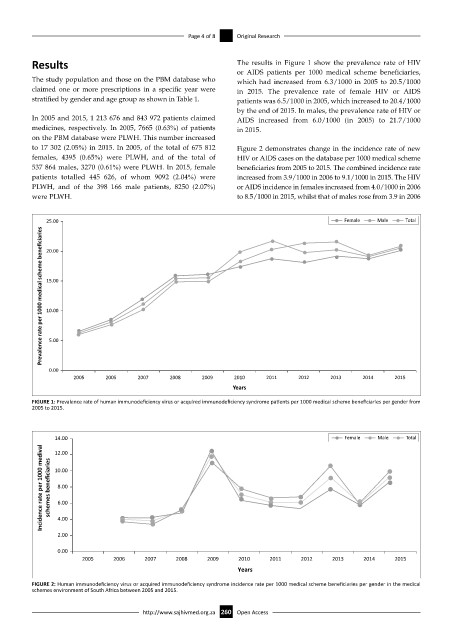
Results The results in Figure 1 show the prevalence rate of HIV
or AIDS patients per 1000 medical scheme beneficiaries,
The study population and those on the PBM database who which had increased from 6.3/1000 in 2005 to 20.5/1000
claimed one or more prescriptions in a specific year were in 2015. The prevalence rate of female HIV or AIDS
stratified by gender and age group as shown in Table 1. patients was 6.5/1000 in 2005, which increased to 20.4/1000
by the end of 2015. In males, the prevalence rate of HIV or
In 2005 and 2015, 1 213 676 and 843 972 patients claimed AIDS increased from 6.0/1000 (in 2005) to 21.7/1000
medicines, respectively. In 2005, 7665 (0.63%) of patients in 2015.
on the PBM database were PLWH. This number increased
to 17 302 (2.05%) in 2015. In 2005, of the total of 675 812 Figure 2 demonstrates change in the incidence rate of new
females, 4395 (0.65%) were PLWH, and of the total of HIV or AIDS cases on the database per 1000 medical scheme
537 864 males, 3270 (0.61%) were PLWH. In 2015, female beneficiaries from 2005 to 2015. The combined incidence rate
patients totalled 445 626, of whom 9092 (2.04%) were increased from 3.9/1000 in 2006 to 9.1/1000 in 2015. The HIV
PLWH, and of the 398 166 male patients, 8250 (2.07%) or AIDS incidence in females increased from 4.0/1000 in 2006
were PLWH. to 8.5/1000 in 2015, whilst that of males rose from 3.9 in 2006
25.00 Female Male Total
Prevalence rate per 1000 medical scheme beneficiaries
20.00
15.00
10.00
5.00
0.00
2005 2005 2007 2008 2009 2010 2011 2012 2013 2014 2015
Years
FIGURE 1: Prevalence rate of human immunodeficiency virus or acquired immunodeficiency syndrome patients per 1000 medical scheme beneficiaries per gender from
2005 to 2015.
14.00 Female Male Total
Incidence rate per 1000 medival schemes beneficiaries 10.00
12.00
8.00
6.00
4.00
2.00
0.00
2005 2006 2007 2008 2009 2010 2011 2012 2013 2014 2015
Years
FIGURE 2: Human immunodeficiency virus or acquired immunodeficiency syndrome incidence rate per 1000 medical scheme beneficiaries per gender in the medical
schemes environment of South Africa between 2005 and 2015.
http://www.sajhivmed.org.za 260 Open Access