
Page 270 - HIVMED_v21_i1.indb
P. 270
Page 6 of 8 Original Research
Eastern Cape Free State Gauteng KwaZulu-Natal Limpopo Mpumalanga North West Northern Cape
Not indicated Western Cape
500
450
400
Prevalence rate of HIV or AIDS 300
350
250
200
150
100
50
0
2005 2006 2007 2008 2009 2010 2011 2012 2013 2014 2015
Year
HIV or AIDS, human immunodeficiency virus or acquired immunodeficiency syndrome.
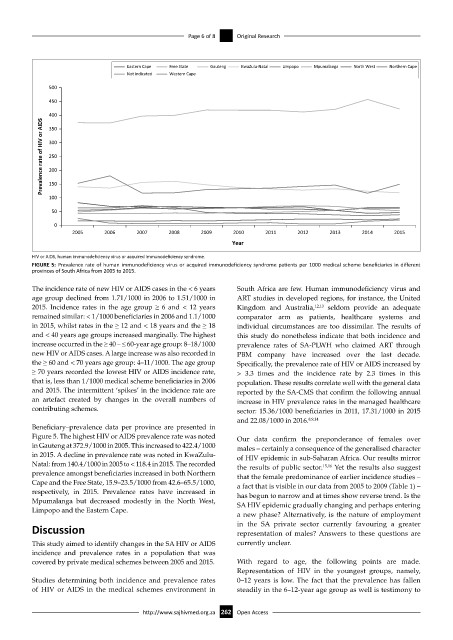
FIGURE 5: Prevalence rate of human immunodeficiency virus or acquired immunodeficiency syndrome patients per 1000 medical scheme beneficiaries in different
provinces of South Africa from 2005 to 2015.
The incidence rate of new HIV or AIDS cases in the < 6 years South Africa are few. Human immunodeficiency virus and
age group declined from 1.71/1000 in 2006 to 1.51/1000 in ART studies in developed regions, for instance, the United
2015. Incidence rates in the age group ≥ 6 and < 12 years Kingdom and Australia, 12,13 seldom provide an adequate
remained similar: < 1/1000 beneficiaries in 2006 and 1.1/1000 comparator arm as patients, healthcare systems and
in 2015, whilst rates in the ≥ 12 and < 18 years and the ≥ 18 individual circumstances are too dissimilar. The results of
and < 40 years age groups increased marginally. The highest this study do nonetheless indicate that both incidence and
increase occurred in the ≥ 40 – ≤ 60-year age group: 8–18/1000 prevalence rates of SA-PLWH who claimed ART through
new HIV or AIDS cases. A large increase was also recorded in PBM company have increased over the last decade.
the ≥ 60 and < 70 years age group: 4–11/1000. The age group Specifically, the prevalence rate of HIV or AIDS increased by
≥ 70 years recorded the lowest HIV or AIDS incidence rate, > 3.3 times and the incidence rate by 2.3 times in this
that is, less than 1/1000 medical scheme beneficiaries in 2006 population. These results correlate well with the general data
and 2015. The intermittent ‘spikes’ in the incidence rate are reported by the SA-CMS that confirm the following annual
an artefact created by changes in the overall numbers of increase in HIV prevalence rates in the managed healthcare
contributing schemes. sector: 15.36/1000 beneficiaries in 2011, 17.31/1000 in 2015
and 22.08/1000 in 2016. 8,9,14
Beneficiary–prevalence data per province are presented in
Figure 5. The highest HIV or AIDS prevalence rate was noted Our data confirm the preponderance of females over
in Gauteng at 372.9/1000 in 2005. This increased to 422.4/1000 males – certainly a consequence of the generalised character
in 2015. A decline in prevalence rate was noted in KwaZulu- of HIV epidemic in sub-Saharan Africa. Our results mirror
Natal: from 140.4/1000 in 2005 to < 118.4 in 2015. The recorded the results of public sector. 15,16 Yet the results also suggest
prevalence amongst beneficiaries increased in both Northern that the female predominance of earlier incidence studies –
Cape and the Free State, 15.9–23.5/1000 from 42.6–65.5/1000, a fact that is visible in our data from 2005 to 2009 (Table 1) –
respectively, in 2015. Prevalence rates have increased in has begun to narrow and at times show reverse trend. Is the
Mpumalanga but decreased modestly in the North West, SA HIV epidemic gradually changing and perhaps entering
Limpopo and the Eastern Cape.
a new phase? Alternatively, is the nature of employment
Discussion in the SA private sector currently favouring a greater
representation of males? Answers to these questions are
This study aimed to identify changes in the SA HIV or AIDS currently unclear.
incidence and prevalence rates in a population that was
covered by private medical schemes between 2005 and 2015. With regard to age, the following points are made.
Representation of HIV in the youngest groups, namely,
Studies determining both incidence and prevalence rates 0–12 years is low. The fact that the prevalence has fallen
of HIV or AIDS in the medical schemes environment in steadily in the 6–12-year age group as well is testimony to
http://www.sajhivmed.org.za 262 Open Access