Page 315 - SAHCS HIVMed Journal Vol 20 No 1 2019
P. 315
Page 4 of 7  Original Research


              interval [CI] 1.37–4.14) (p = 0.002) (Table 3).  A neutrophil   suspected immune  reconstitution syndrome after having
              count ≤ 0.5 × 10 /L was found more commonly in those with   been on ART for 3 months.
                          9
              a unique diagnosis (p = 0.05); however, the numbers in this
              group were too small to interpret correctly.          Discussion

              Diagnosis of mycobacterial infection                  In the current study, the cohort comprised patients from
              on bone marrow examination                            an  ID ward at a tertiary level referral hospital covering a
                                                                    population of over 4 million  individuals  from central and
              Of the 327 bone marrow investigations performed,      northern Johannesburg.   A total of 327 bone marrow
                                                                                       17
              microbiological confirmation of MTB and MAC were made   investigations were performed during the 3-year study
              in 54 and 4 cases, respectively. Of the 226 bone marrow   period. This sample size is larger per time period compared
              mycobacterial cultures performed 55 yielded positive results   to international studies which, on average, have taken longer
              (24.3%). Of the 182 ZN stains performed 51 yielded positive   to review similar numbers viz. 8 to 9 years. 5,6,11  This difference
              results (28.0%). Six MTB PCRs were commented on as    may be accounted for by the high burden of HIV infection
              positive; however, it was not noted how many MTB PCR   and tuberculosis in this region compared to developed
              tests were performed that yielded negative results, and thus   countries.
                                                                           18
                                                        9
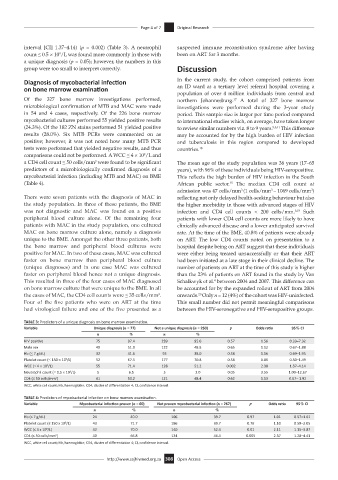
              comparisons could not be performed. A WCC ≤ 4 × 10 /L and
              a CD4 cell count ≤ 50 cells/mm  were found to be significant   The mean age of the study population was 36 years (17–65
                                       3
              predictors of a microbiologically confirmed diagnosis of a   years), with 96% of these individuals being HIV-seropositive.
              mycobacterial infection (including MTB and MAC) on BME   This reflects the high burden of HIV infection in the South
              (Table 4).                                            African public sector.  The median CD4 cell count at
                                                                                      15
                                                                    admission was 47 cells/mm (1 cells/mm – 1069 cells/mm )
                                                                                                                   3
                                                                                          3
                                                                                                     3
              There were seven patients with the diagnosis of MAC in   reflecting not only delayed health-seeking behaviour but also
              the study population. In three of these patients, the BME   the higher morbidity in those with advanced stages of HIV
              was not diagnostic and MAC was found on a positive    infection and CD4 cell counts < 200 cells/mm. 3,19  Such
              peripheral blood culture alone. Of the remaining four   patients with lower CD4 cell counts are more likely to have
              patients with MAC in the study population, one cultured   clinically advanced disease and a lower anticipated survival
              MAC on bone marrow culture alone, namely a diagnosis   rate. At the time of the BME, 40.8% of patients were already
              unique to the BME. Amongst the other three patients, both   on  ART. The low CD4 counts noted on presentation to a
              the bone marrow and peripheral blood cultures were    hospital despite being on ART suggest that these individuals
              positive for MAC. In two of these cases, MAC was cultured   were either being treated unsuccessfully or that their ART
              faster on bone marrow than peripheral blood culture   had been initiated at a late stage in their clinical decline. The
              (unique diagnoses) and in one case MAC was cultured   number of patients on ART at the time of this study is higher
              faster on peripheral blood hence not a unique diagnosis.   than the 23% of patients on ART found in the study by Van
              This resulted in three of the four cases of MAC diagnosed   Schalkwyk et al.  between 2004 and 2007. This difference can
                                                                                 4
              on bone marrow culture that were unique to the BME. In all   be accounted for by the expanded rollout of ART from 2004
              the cases of MAC, the CD4 cell counts were ≤ 35 cells/mm .   onwards.  Only n = 12 (4%) of the cohort was HIV-uninfected.
                                                             3
                                                                           20
              Four of the five patients who were on  ART  at the time   This small number did not permit meaningful comparisons
              had virological failure and one of the five presented as a   between the HIV-seronegative and HIV-seropositive groups.
              TABLE 3: Predictors of a unique diagnosis on bone marrow examination.
              Variable                Unique diagnosis (n = 77)   Not a unique diagnosis (n = 250)   p   Odds ratio   95% CI
                                       n           %           n          %
              HIV positive             75         97.4        239         95.6       0.57        1.56      0.33–7.32
              Male sex                 40         51.9        122         48.8       0.65        1.12      0.67–1.88
              Hb (≤ 7 g/dL)            32         41.6        95          38.0       0.58        1.16      0.69–1.95
              Platelet count (≤ 150 × 10 /L)  52   67.5       177         70.8       0.58        0.86      0.50–1.49
                            9
              WCC (≤ 4 × 10 /L)        55         71.4        128         51.2       0.002       2.38      1.37–4.14
                      9
              Neutrophil count (≤ 0.5 × 10 /L)  5   6.5        5          2.0        0.05        3.55      1.00–12.67
                              9
              CD4 (≤ 50 cells/mm ) 3   41         53.2        121         48.4       0.62        1.13      0.67– 1.92
              WCC, white cell count; Hb, haemoglobin; CD4, cluster of differentiation 4; CI, confidence interval.
              TABLE 4: Predictors of mycobacterial infection on bone marrow examination.
              Variable           Mycobacterial infection proven (n = 60)  Not proven mycobacterial infection (n = 267)  p  Odds ratio  95% CI
                                      n             %             n              %
              Hb (≤ 7 g/dL)           24           40.0          106            39.7        0.97     1.01    0.57–1.61
              Platelet count (≤ 150 x 10 /L)  43   71.7          186            69.7        0.76     1.10    0.59–2.05
                            9
              WCC (≤ 4 x 10 /L)       42           70.0          140            52.4        0.01     2.11    1.15–3.87
                      9
              CD4 (≤ 50 cells/mm ) 3  40           66.8          124            46.4        0.005    2.37    1.28–4.41
              WCC, white cell count; Hb, haemoglobin; CD4, cluster of differentiation 4; CI, confidence interval.
                                           http://www.sajhivmed.org.za 308  Open Access

