
Page 277 - SAHCS HIVMed Journal Vol 20 No 1 2019
P. 277
Page 3 of 10 Original Research
who were lost to follow-up (LTFU) or had transferred out of analysed anonymised TIER.Net data that were routinely
the ART programme were also excluded. collected at healthcare facilities for monitoring purposes. No
data collection was performed for the purposes of this study.
Statistical analysis In addition, no patient files or electronic medical records
were retrieved or accessed at any stage.
Descriptive statistics were used to explore trends in ART
initiation and baseline CD4 counts over time. Kaplan–Meier Results
survival analysis was used to estimate the probability of
death over time in clients with low baseline CD4 counts Description of study population
(< 200 cells/mm ). Only clients known to have died and those The Johannesburg data set comprised 340 023 records from
3
active in care were included in the Kaplan–Meier analysis. adult clients aged 15–80 years initiating ART between 2004
Follow-up time, defined as the time between ART start and and 2017. Records from 83 677 (25%) clients were excluded,
last ART visit, was censored at 5 years after ART initiation. as these individuals were not newly initiating ART. A
Where clients died after the initiation visit (i.e. ART initiation further 53 178 (16%) records were excluded because of missing
date and last visit date were the same), a follow-up time of baseline CD4 counts. Among the remaining 203 168 records,
half a day (0.001 years) was assigned. Survival curves were 37 (< 1%) had baseline CD4 counts above 2000 and thus were
compared using a Peto–Peto–Prentice test for equality of also excluded, leaving a Johannesburg data set of 203 131
survivor functions, which is not affected by differences in records for analysis. The initial Mopani data set comprised
censoring patterns across groups and is appropriate even 159 904 records from adults initiating ART between 2004 and
when hazard functions are not proportional. 23 2017, of which 36 553 (23%) were excluded because of ART
initiation in clients who were not treatment naïve and a further
To describe the population presenting late for HIV care in 21 517 (13%) were excluded because of missing baseline CD4
2017, clients with baseline CD4 counts < 200 cells/mm were counts. Among the remaining 101 834 records, 20 (< 1%) with
3
compared to those with CD4 counts ≥ 200 cells/mm using baseline CD4 counts above 2000 were also excluded, leaving a
3
Mann–Whitney and chi-squared (χ ) or Fisher’s exact tests Mopani data set of 101 814 records for analysis.
2
for continuous and categorical variables, respectively. Viral
load suppression was calculated using the last viral load test Antiretroviral therapy initiation and baseline
on record for each client and was defined as a last viral load CD4 counts over time
result < 1000 copies/mL as per South African guidelines,
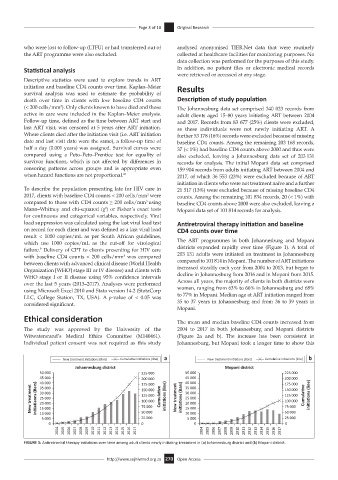
which use 1000 copies/mL as the cut-off for virological The ART programmes in both Johannesburg and Mopani
failure. Delivery of CPT to clients presenting for HIV care districts expanded rapidly over time (Figure 1). A total of
9
3
with baseline CD4 counts < 200 cells/mm was compared 203 131 adults were initiated on treatment in Johannesburg
between clients with advanced clinical disease (World Health compared to 101 814 in Mopani. The number of ART initiations
Organization [WHO] stage III or IV disease) and clients with increased steadily each year from 2004 to 2013, but began to
WHO stage I or II disease using 95% confidence intervals decline in Johannesburg from 2016 and in Mopani from 2015.
over the last 5 years (2013–2017). Analyses were performed Across all years, the majority of clients in both districts were
using Microsoft Excel 2010 and Stata version 14.2 (StataCorp women, ranging from 63% to 66% in Johannesburg and 68%
LLC, College Station, TX, USA). A p-value of < 0.05 was to 77% in Mopani. Median age at ART initiation ranged from
considered significant. 35 to 37 years in Johannesburg and from 36 to 39 years in
Mopani.
Ethical consideration The mean and median baseline CD4 counts increased from
The study was approved by the University of the 2004 to 2017 in both Johannesburg and Mopani districts
Witwatersrand’s Medical Ethics Committee (M140461). (Figure 2a and b). The increase has been consistent in
Individual patient consent was not required as this study Johannesburg, but Mopani took a longer time to show this
New treatment ini a ons (Bars) Cumula ve ini a ons (line) a New treatment ini a ons (Bars) Cumula ve ini a ons (line) b
Johannesburg district Mopani district
50 000 225 000 50 000 225 000
45 000 200 000 45 000 200 000
40 000
40 000
175 000
175 000
New treatment ini a aons (Bars) 30 000 150 000 Cumula ve ini a ons (line) New treatment ini a ons (Bars) 30 000 150 000 Cumula ve ini a ons (line)
35 000
35 000
125 000
125 000
25 000
25 000
100 000
100 000
20 000
20 000
75 000
75 000
15 000
15 000
10 000
25 000
25 000
5 000
5 000 50 000 10 000 50 000
0 0 0 0
2004 2005 2006 2007 2008 2009 2010 2011 2012 2013 2014 2015 2016 2017 2004 2005 2006 2007 2008 2009 2010 2011 2012 2013 2014 2015 2016 2017
FIGURE 1: Antiretroviral therapy initiations over time among adult clients newly initiating treatment in (a) Johannesburg district and (b) Mopani district.
http://www.sajhivmed.org.za 270 Open Access