
Page 279 - SAHCS HIVMed Journal Vol 20 No 1 2019
P. 279
Page 5 of 10 Original Research
a b
<200 200–349 ≥350 <200 200–349 ≥350
Jhb: Deaths to 5 years by baseline CD4 count Mopani: Deaths to 5 years by baseline CD4 count
1.00 1.00
0.95
Propor on alive and in care 0.90 Propor on alive and in care 0.90
0.95
0.85
0.85
0.80
0.80
0.75
0.75
0.70
0 p<0.001 1 2 3 4 5 0.70 0 p<0.001 1 2 3 4 5
Analysis me: Years Analysis me: Years
Number at risk Number at risk
<200 57419 (2274) 46603 (389) 37809 (218) 30410 (139) 23859 (83) 18071 <200 25814 (3607) 20260 (700) 16757 (447) 13724 (290) 10725 (194) 7804
200-349 34731 (321) 29097 (91) 23317 (54) 18147 (43) 13175 (17) 8574 200-349 17324 (593) 15365 (169) 13046 (116) 10656 (105) 7995 (62) 5261
≥350 27149 (117) 18928 (35) 10347 (11) 4813 (10) 2773 (5) 1533 ≥350 12314 (250) 9652 (55) 5878 (30) 2882 (16) 1370 (3) 375
2010–2011 2012–2013 2014–2015 2016–2017 c 2010–2011 2012–2013 2014–2015 2016–2017 d
Jhb: Deaths by ART start yr in clients with baseline CD4 <200 Mopani: Deaths by ART start yr in clients with baseline CD4 <200
1.00 1.00
Propor on alive and in care 0.95 Propor on alive and in care 0.95
0.90
0.90
0.85
0.85
0.80
0.80
0.75
0.75
0.70
0 p<0.001 1 2 3 4 5 0.70 0 p<0.001 1 2 3 4 5
Analysis me: Years Analysis me: Years
Number at risk Number at risk
2010-2011 8050 (407) 7642 (101) 7541 (69) 7471 (38) 7428 (28) 7397 2010-2011 4529 (750) 3779 (167) 3612 (111) 3501 (83) 3418 (80) 3338
2012-2013 11266 (545) 10715 (107) 10600 (57) 10523 (44) 10258 (17) 5385 2012-2013 7252 (1027) 6225 (221) 6004 (177) 5827 (117) 5686 (76) 3294
2014-2015 14088 (445) 13585 (71) 13228 (35) 7045 (12) 847 (1) 0 2014-2015 6243 (642) 5600 (158) 5416 (77) 3122 (26) 411 0 0
2016-2017 17954 (337) 9140 (17) 1012 (0) 0 (0) 0 (0) 0 2016-2017 5538 (410) 3182 (36) 369 (0) 0 (0) 0 0 0
2004–2009 2010–2012 2013–2017 e 2004–2009 2010–2012 2013–2017 f
Jhb: Deaths by ART start yr in clients with baseline CD4 <200 Mopani: Deaths by ART start yr in clients with baseline CD4 <200
1.00 1.00
Propor on alive and in care 0.80 Propor on alive and in care 0.80
0.90
0.90
0.70
0.70
0.60
0.50
0.50 p<0.001 0.60 p<0.001
0 1 2 3 4 5 0 1 2 3 4 5
Analysis me: Years Analysis me: Years
Number at risk Number at risk
2004-2009 6061 (540) 5521 (93) 5428 (57) 5371 (45) 5326 (37) 5289 2004-2009 2252 (778) 1474 (118) 1356 (82) 1274 (64) 1210 (38) 1172
2010-2012 13430 (682) 12745 (170) 12572 (103) 12463 (66) 12380 (42) 12164 2010-2012 8341 (1305) 7036 (299) 6737 (204) 6533 (145) 6388 (136) 6230
2013-2017 37928 (1052) 28337 (126) 19809 (58) 12576 (28) 6153 (4) 618
2013-2017 15221 (1524) 11750 (283) 8664 (161) 5917 (81) 3127 (20) 402
p = Peto–Peto test for equality of survivor functions. ART, antiretroviral therapy; Jhb, Johannesburg district.
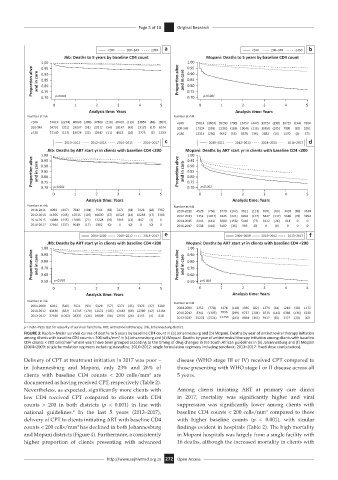
FIGURE 3: Kaplan–Meier survival curves of deaths to 5 years by baseline CD4 count in (a) Johannesburg and (b) Mopani. Deaths by year of antiretroviral therapy initiation
3
among clients with baseline CD4 counts < 200 cells/mm in (c) Johannesburg and (d) Mopani. Deaths by year of antiretroviral therapy initiation among clients with baseline
CD4 counts < 200 cells/mm where years have been grouped according to the timing of drug changes in the South African guidelines in (e) Johannesburg and (f) Mopani
3
(2004–2009: single formulation regimens including stavudine; 2010–2012: single formulation regimens including tenofovir; 2013–2017: fixed-dose combination).
Delivery of CPT at treatment initiation in 2017 was poor – disease (WHO stage III or IV) received CPT compared to
in Johannesburg and Mopani, only 23% and 26% of those presenting with WHO stage I or II disease across all
clients with baseline CD4 counts < 200 cells/mm are 5 years.
3
documented as having received CPT, respectively (Table 2).
Nevertheless, as expected, significantly more clients with Among clients initiating ART at primary care clinics
low CD4 received CPT compared to clients with CD4 in 2017, mortality was significantly higher and viral
counts > 200 in both districts (p < 0.001) in line with suppression was significantly lower among clients with
national guidelines. In the last 5 years (2013–2017), baseline CD4 counts < 200 cells/mm compared to those
3
9
delivery of CPT to clients initiating ART with baseline CD4 with higher baseline counts (p < 0.001), with similar
counts < 200 cells/mm has declined in both Johannesburg findings evident in hospitals (Table 2). The high mortality
3
and Mopani districts (Figure 4). Furthermore, a consistently in Mopani hospitals was largely from a single facility with
higher proportion of clients presenting with advanced 16 deaths, although the increased mortality in clients with
http://www.sajhivmed.org.za 272 Open Access