
Page 280 - SAHCS HIVMed Journal Vol 20 No 1 2019
P. 280
Page 6 of 10 Original Research
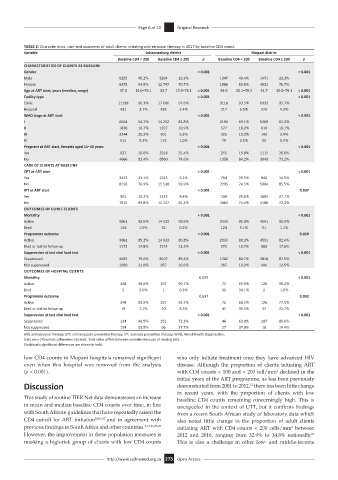
TABLE 2: Characteristics, care and outcomes of adult clients initiating antiretroviral therapy in 2017 by baseline CD4 count.
Variable Johannesburg district Mopani district
Baseline CD4 < 200 Baseline CD4 ≥ 200 p Baseline CD4 < 200 Baseline CD4 ≥ 200 p
CHARACTERISTICS OF CLIENTS AT BASELINE
Gender < 0.001 < 0.001
Male 5255 45.2% 5294 29.3% 1347 40.4% 1471 23.3%
Female 6375 54.8% 12 747 70.7% 1986 59.6% 4831 76.7%
Age at ART start, years (median, range) 37.0 15.0–79.1 33.7 15.0–78.1 < 0.001 39.0 15.1–78.2 34.7 15.0–79.3 < 0.001
Facility type < 0.001 < 0.001
Clinic 11199 96.3% 17 606 97.6% 3116 93.5% 6032 95.7%
Hospital 431 3.7% 435 2.4% 217 6.5% 270 4.3%
WHO stage at ART start < 0.001 < 0.001
I 6044 54.7% 14 252 82.8% 2190 69.1% 5269 87.2%
II 1838 16.7% 1877 10.9% 577 18.2% 610 10.1%
III 2244 20.3% 901 5.2% 325 10.3% 142 2.4%
IV 915 8.3% 175 1.0% 79 2.5% 22 0.4%
Pregnant at ART start, females aged 15–50 years < 0.001 < 0.001
Yes 927 16.6% 2918 25.4% 255 15.8% 1115 26.8%
No 4666 83.4% 8560 74.6% 1358 84.2% 3049 73.2%
CARE OF CLIENTS AT BASELINE
CPT at ART start < 0.001 < 0.001
Yes 2453 23.1% 1015 6.1% 784 25.5% 846 14.5%
No 8156 76.9% 15 538 93.9% 2295 74.5% 5004 85.5%
IPT at ART start < 0.001 0.037
Yes 901 10.2% 1422 8.8% 709 25.6% 1605 27.7%
No 7915 89.8% 14 747 91.2% 2063 74.4% 4186 72.3%
OUTCOMES OF CLINIC CLIENTS
Mortality < 0.001 < 0.001
Active 9061 98.5% 14 533 99.8% 2333 95.0% 4591 98.9%
Died 140 1.5% 32 0.2% 124 5.1% 51 1.1%
Programme outcome < 0.001 0.019
Active 9061 85.2% 14 533 86.8% 2333 80.3% 4591 82.4%
Died or lost to follow-up 1572 14.8% 2214 13.2% 573 19.7% 983 17.6%
Suppression at last viral load test < 0.001 < 0.001
Suppressed 4092 79.0% 8107 89.4% 1202 80.7% 2818 87.5%
Not suppressed 1090 21.0% 957 10.6% 287 19.3% 404 12.5%
OUTCOMES OF HOSPITAL CLIENTS
Mortality 0.099 < 0.001
Active 248 98.0% 297 99.7% 72 69.9% 126 98.4%
Died 5 2.0% 1 0.3% 31 30.1% 2 1.6%
Programme outcome 0.697 0.002
Active 248 92.9% 297 93.7% 72 60.5% 126 77.3%
Died or lost to follow-up 19 7.1% 20 6.3% 47 39.5% 37 22.7%
Suppression at last viral load test < 0.001 < 0.001
Suppressed 134 46.5% 251 72.3% 46 63.0% 107 85.6%
Not suppressed 154 53.5% 96 27.7% 27 37.0% 18 14.4%
ART, antiretroviral therapy; CPT, cotrimoxazole preventive therapy; IPT, isoniazid preventive therapy; WHO, World Health Organization.
Data are n (%) unless otherwise indicated. Total value differs between variables because of missing data.
Statistically significant differences are shown in bold.
low CD4 counts in Mopani hospitals remained significant who only initiate treatment once they have advanced HIV
even when this hospital was removed from the analysis disease. Although the proportion of clients initiating ART
(p < 0.001). with CD4 counts < 100 and < 200 cell/mm declined in the
3
initial years of the ART programme, as has been previously
Discussion demonstrated from 2001 to 2012, there has been little change
12
in recent years, with the proportion of clients with low
This study of routine TIER.Net data demonstrates an increase baseline CD4 counts remaining concerningly high. This is
in mean and median baseline CD4 counts over time, in line unexpected in the context of UTT, but it confirms findings
with South African guidelines that have repeatedly raised the from a recent South African study of laboratory data which
CD4 cut-off for ART initiation 5,8,9,10 and in agreement with also noted little change in the proportion of adult clients
previous findings in South Africa and other countries. 2,16,24,25,26 initiating ART with CD4 counts < 200 cells/mm between
3
However, the improvement in these population measures is 2012 and 2016, ranging from 32.9% to 34.8% nationally.
27
masking a high-risk group of clients with low CD4 counts This is also a challenge in other low- and middle-income
http://www.sajhivmed.org.za 273 Open Access