
Page 270 - SAHCS HIVMed Journal Vol 20 No 1 2019
P. 270
Page 6 of 10 Original Research
for the secondary endpoint of HIV-1 RNA < 50 copies/mL at re-consent to continue the study at another site after their
week 48 were identical to those for the primary endpoint for initial site closed because of administrative reasons. In the PP
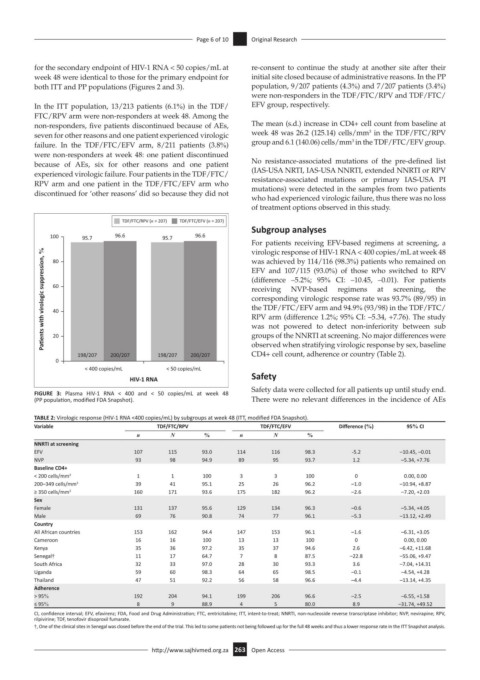
both ITT and PP populations (Figures 2 and 3). population, 9/207 patients (4.3%) and 7/207 patients (3.4%)
were non-responders in the TDF/FTC/RPV and TDF/FTC/
In the ITT population, 13/213 patients (6.1%) in the TDF/ EFV group, respectively.
FTC/RPV arm were non-responders at week 48. Among the
non-responders, five patients discontinued because of AEs, The mean (s.d.) increase in CD4+ cell count from baseline at
3
seven for other reasons and one patient experienced virologic week 48 was 26.2 (125.14) cells/mm in the TDF/FTC/RPV
3
failure. In the TDF/FTC/EFV arm, 8/211 patients (3.8%) group and 6.1 (140.06) cells/mm in the TDF/FTC/EFV group.
were non-responders at week 48: one patient discontinued
because of AEs, six for other reasons and one patient No resistance-associated mutations of the pre-defined list
experienced virologic failure. Four patients in the TDF/FTC/ (IAS-USA NRTI, IAS-USA NNRTI, extended NNRTI or RPV
RPV arm and one patient in the TDF/FTC/EFV arm who resistance-associated mutations or primary IAS-USA PI
mutations) were detected in the samples from two patients
discontinued for ‘other reasons’ did so because they did not
who had experienced virologic failure, thus there was no loss
of treatment options observed in this study.
TDF/FTC/RPV (n = 207) TDF/FTC/EFV (n = 207)
Subgroup analyses
100 95.7 96.6 95.7 96.6
For patients receiving EFV-based regimens at screening, a
Pa ents with virologic suppression, % 60 (difference –5.2%; 95% CI: –10.45, –0.01). For patients
virologic response of HIV-1 RNA < 400 copies/mL at week 48
was achieved by 114/116 (98.3%) patients who remained on
80
EFV and 107/115 (93.0%) of those who switched to RPV
regimens
NVP-based
at
the
screening,
receiving
corresponding virologic response rate was 93.7% (89/95) in
the TDF/FTC/EFV arm and 94.9% (93/98) in the TDF/FTC/
40
RPV arm (difference 1.2%; 95% CI: –5.34, +7.76). The study
was not powered to detect non-inferiority between sub
20
observed when stratifying virologic response by sex, baseline
CD4+ cell count, adherence or country (Table 2).
198/207 200/207 198/207 200/207 groups of the NNRTI at screening. No major differences were
0
< 400 copies/mL < 50 copies/mL
HIV-1 RNA Safety
Safety data were collected for all patients up until study end.
FIGURE 3: Plasma HIV-1 RNA < 400 and < 50 copies/mL at week 48
(PP population, modified FDA Snapshot). There were no relevant differences in the incidence of AEs
TABLE 2: Virologic response (HIV-1 RNA <400 copies/mL) by subgroups at week 48 (ITT, modified FDA Snapshot).
Variable TDF/FTC/RPV TDF/FTC/EFV Difference (%) 95% CI
n N % n N %
NNRTI at screening
EFV 107 115 93.0 114 116 98.3 -5.2 –10.45, –0.01
NVP 93 98 94.9 89 95 93.7 1.2 –5.34, +7.76
Baseline CD4+
< 200 cells/mm 3 1 1 100 3 3 100 0 0.00, 0.00
200–349 cells/mm 3 39 41 95.1 25 26 96.2 –1.0 –10.94, +8.87
≥ 350 cells/mm 3 160 171 93.6 175 182 96.2 –2.6 –7.20, +2.03
Sex
Female 131 137 95.6 129 134 96.3 –0.6 –5.34, +4.05
Male 69 76 90.8 74 77 96.1 –5.3 –13.12, +2.49
Country
All African countries 153 162 94.4 147 153 96.1 –1.6 –6.31, +3.05
Cameroon 16 16 100 13 13 100 0 0.00, 0.00
Kenya 35 36 97.2 35 37 94.6 2.6 –6.42, +11.68
Senegal† 11 17 64.7 7 8 87.5 –22.8 –55.06, +9.47
South Africa 32 33 97.0 28 30 93.3 3.6 –7.04, +14.31
Uganda 59 60 98.3 64 65 98.5 –0.1 –4.54, +4.28
Thailand 47 51 92.2 56 58 96.6 –4.4 –13.14, +4.35
Adherence
> 95% 192 204 94.1 199 206 96.6 –2.5 –6.55, +1.58
≤ 95% 8 9 88.9 4 5 80.0 8.9 –31.74, +49.52
CI, confidence interval; EFV, efavirenz; FDA, Food and Drug Administration; FTC, emtricitabine; ITT, intent-to-treat; NNRTI, non-nucleoside reverse transcriptase inhibitor; NVP, nevirapine; RPV,
rilpivirine; TDF, tenofovir disoproxil fumarate.
†, One of the clinical sites in Senegal was closed before the end of the trial. This led to some patients not being followed up for the full 48 weeks and thus a lower response rate in the ITT Snapshot analysis.
http://www.sajhivmed.org.za 263 Open Access