
Page 269 - SAHCS HIVMed Journal Vol 20 No 1 2019
P. 269
Page 5 of 10 Original Research
TABLE 1: Baseline and disease characteristics.
Characteristic TDF/FTC/RPV (n = 213) TDF/FTC/EFV (n = 211) All patients (n = 424)
n N % s.d. n N % s.d. n N % s.d.
Female 137 - 64.3 - 134 - 63.5 - 271 - 63.9 -
Women of childbearing potential 98 137 71.5 - 97 134 72.4 - 195 271 72.0 -
Mean age, years 40.6 - - 8.0 40.6 - - 8.7 40.6 - - 8.3
Race
Black people 157 - 73.7 - 152 - 72.0 - 309 - 72.9 -
Asian 51 - 23.9 - 58 - 27.5 - 109 - 25.7 -
Other 5 - 2.3 - 1 - 0.5 - 6 - 1.4 -
Nationality
Cameroon 16 - 7.5 - 13 - 6.2 - 29 - 6.8 -
Kenya 36 - 16.9 - 37 - 17.5 - 73 - 17.2 -
Senegal 17 - 8.0 - 8 - 3.8 - 25 - 5.9 -
South Africa 33 - 15.5 - 30 - 14.2 - 63 - 14.9 -
Thailand 51 - 23.9 - 58 - 27.5 - 109 - 25.7 -
Uganda 60 - 28.2 - 65 - 30.8 - 125 - 29.5 -
Mean BMI (kg/m ) 2 24.25 - - 4.8 24.11 - - 5.0 24.18 - - 4.9
Mode of HIV infection
Heterosexual contact 188 - 88.3 - 188 - 89.1 - 376 - 88.7 -
Men having sex with men 13 - 6.1 - 16 - 7.6 - 29 - 6.8 -
Other 12 - 5.6 - 7 - 3.3 - 19 - 4.5 -
Mean time since diagnosis, years 7.6 - - 4.6 8.2 - - 4.8 7.9 - - 4.7
Mean time since first ART, years 5.8 - - 3.3 6.0 - - 3.3 5.9 - - 3.3
Mean CD4+ cell count, cells/mm³ 545.3 - - 228.2 549.3 - - 207.7 547.3 - - 218.0
Hepatitis reactive
Hepatitis B surface antigen 12 - 5.6 - 10 - 4.7 - 22 - 5.2 -
Hepatitis C antibody 3 - 1.4 - 5 - 2.4 - 8 - 1.9 -
NNRTI at screening
EFV 115 - 54.0 - 116 - 55.0 - 231 - 54.5 -
NVP 98 - 46.0 - 95 - 45.0 - 193 - 45.5 -
NRTI at screening
3TC + ZDV 89 - 41.8 - 89 - 42.2 - 178 - 42.0 -
3TC + TDF 117 - 54.9 - 112 - 53.1 - 229 - 54.0 -
Other 7 - 3.3 - 10 - 4.7 - 17 - 4.0 -
3TC, lamivudine; ART, antiretroviral therapy; BMI, body mass index; EFV, efavirenz; FTC, emtricitabine; NNRTI, non-nucleoside reverse transcriptase inhibitor; NRTI, nucleoside reverse transcriptase
inhibitor; NVP, nevirapine; RPV, rilpivirine; s.d., standard deviation; TDF, tenofovir disoproxil fumarate; ZDV, zidovudine.
a b
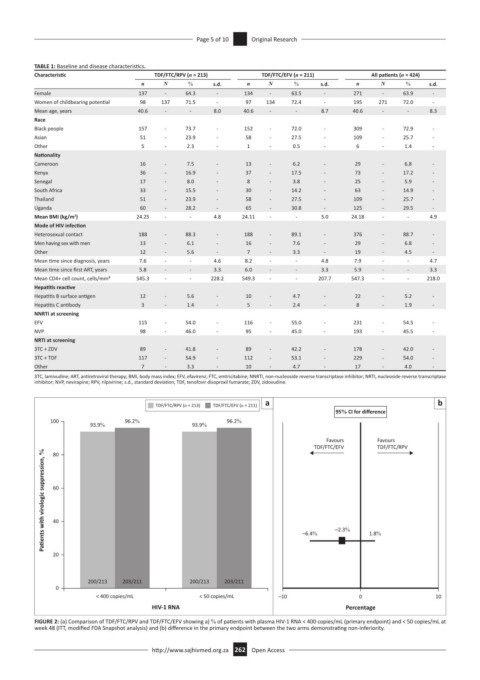
TDF/FTC/RPV (n = 213) TDF/FTC/EFV (n = 211)
95% CI for difference
100 96.2% 96.2%
93.9% 93.9%
Favours Favours
TDF/FTC/EFV TDF/FTC/RPV
Pa ents with virologic suppression, % 60
80
40
20 –6.4% –2.3% 1.8%
200/213 203/211 200/213 203/211
0
< 400 copies/mL < 50 copies/mL –10 0 10
HIV-1 RNA Percentage
FIGURE 2: (a) Comparison of TDF/FTC/RPV and TDF/FTC/EFV showing a) % of patients with plasma HIV-1 RNA < 400 copies/mL (primary endpoint) and < 50 copies/mL at
week 48 (ITT, modified FDA Snapshot analysis) and (b) difference in the primary endpoint between the two arms demonstrating non-inferiority.
http://www.sajhivmed.org.za 262 Open Access