
Page 240 - SAHCS HIVMed Journal Vol 20 No 1 2019
P. 240
Page 3 of 7 Original Research
clinical variables were summarised. Continuous variables individuals (14.8%) were initiated in 2014 and 183 (14.7%) in
were presented as means. Categorical variables were presented 2015. Only 0.3% of the cohort were initiated in 2004.
as percentages or proportions. Mann–Whitney U test was
used to check for equality of the median of the continuous Twenty-four per cent of the cohort were male and the
variables (duration on cART and CD4+ cell count) as they mean age was 36 ± 5 years. Other baseline characteristics
were not normally distributed. Pearson’s chi-square test was of participants are shown in Table 1. Only 0.9% of the
used for categorical variables. cohort had some form of post-exposure prophylaxis (PEP).
Further review showed that 9.8% demised, 10.4% were lost
To model for factors associated with virologic and to follow-up (LTFU), 11.1% transferred out and 68.7% were
immunologic responses, univariate and multivariate logistic retained in care. Fourteen per cent of males demised during
regression analysis was performed. Univariate analysis was the period under review, as compared to 8.4% of females.
performed first, and crude odds ratios for the association This was found to be statistically significant (p = 0.01).
of the variables with immunologic and virologic responses There was no gender difference for those who were LTFU or
determined. The variables included age, year of initiation,
gender, marital status, baseline BMI, haemoglobin, clinical TABLE 1: Socio-demographic and clinical characteristics of cohort. N
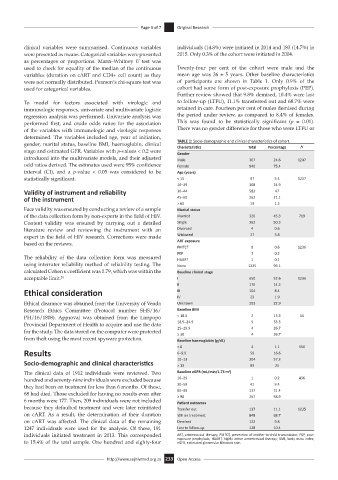
Characteristics
Percentage
Total
stage and estimated GFR. Variables with p-values < 0.2 were Gender
introduced into the multivariate models, and their adjusted Male 307 24.6 1247
odd ratios derived. The estimates used were 95% confidence Female 940 75.4
interval (CI), and a p-value < 0.05 was considered to be Age (years)
statistically significant. < 15 67 5.4 1237
16–29 308 24.9
Validity of instrument and reliability 30–44 582 47
of the instrument 45–60 262 21.1
> 60 19 1.5
Face validity was ensured by conducting a review of a sample Marital status
of the data collection form by non-experts in the field of HIV. Married 326 45.3 719
Content validity was ensured by carrying out a detailed Single 362 50.3
literature review and reviewing the instrument with an Divorced 4 0.6
expert in the field of HIV research. Corrections were made Widowed 27 3.8
based on the reviews. ART exposure
PMTCT 8 0.6 1236
PEP 2 0.2
The reliability of the data collection form was measured HAART 1 0.1
using interrater reliability method of reliability testing. The None 1225 99.1
calculated Cohen κ coefficient was 0.79, which was within the Baseline clinical stage
acceptable limit. 20 I 650 52.6 1236
II 176 14.2
Ethical consideration III 104 8.4
IV 23 1.9
Ethical clearance was obtained from the University of Venda Unknown 283 22.9
Research Ethics Committee (Protocol number SHS/16/ Baseline BMI
PH/16/1808). Approval was obtained from the Limpopo < 18.5 2 13.3 15
Provincial Department of Health to acquire and use the data 18.5–24.9 5 4 33.3
26.7
25–29.9
for the study. The data stored on the computer were protected ≥ 30 4 26.7
from theft using the most recent spyware protection. Baseline haemoglobin (g/dL)
< 6 4 1.1 356
Results 6–9.9 59 16.6
Socio-demographic and clinical characteristics 10–13 204 57.3
> 13
89
25
2
The clinical data of 1912 individuals were reviewed. Two Baseline eGFR (mL/min/1.73 m )
hundred and seventy-nine individuals were excluded because 16–29 1 0.2 436
9.4
41
they had been on treatment for less than 6 months. Of these, 30–59 137 31.4
60–89
68 had died. Those excluded for having no results even after ≥ 90 257 58.9
6 months were 177. Then, 209 individuals were not included Patient outcomes
because they defaulted treatment and were later reinitiated Transfer out 137 11.1 1235
on cART. As a result, the determination of their duration Still on treatment 848 68.7
on cART was affected. The clinical data of the remaining Demised 122 9.8
1247 individuals were used for the analysis. Of these, 191 Lost to follow-up 128 10.4
individuals initiated treatment in 2013. This corresponded ART, antiretroviral therapy; PMTCT, prevention of mother-to-child transmission; PEP, post-
exposure prophylaxis; HAART, highly active antiretroviral therapy; BMI, body mass index;
to 15.4% of the total sample. One hundred and eighty-four eGFR, estimated glomerular filtration rate.
http://www.sajhivmed.org.za 233 Open Access