
Page 242 - SAHCS HIVMed Journal Vol 20 No 1 2019
P. 242
Page 5 of 7 Original Research
of ≤ 200 cells/µL were compared with those with a baseline Univariate analysis showed that for every unit increase in
CD4+ cell count > 200 cells/µL. The calculated immuno- haemoglobin, the odds of attaining viral suppression increase
virologic discordance for this cohort was 27% (n = 415). Also, by 9%. Other factors significantly associated with viral
of those that achieved viral suppression at 60 months, 56.4% suppression are age (31–60 years versus ≤ 15 years), gender
achieved a CD4+ cell count. (female) and WHO clinical stage II and III versus stage I.
These findings were similar when multivariate logistic
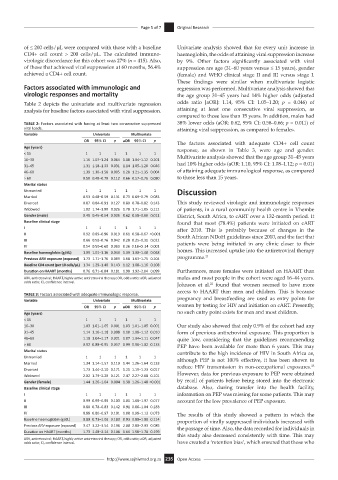
Factors associated with immunologic and regression was performed. Multivariate analysis showed that
virologic responses and mortality the age group 31–45 years had 14% higher odds (adjusted
Table 2 depicts the univariate and multivariate regression odds ratio [aOR]: 1.14, 95% CI: 1.05–1.20; p = 0.046) of
analysis for baseline factors associated with viral suppression. attaining at least one consecutive viral suppression, as
compared to those less than 15 years. In addition, males had
TABLE 2: Factors associated with having at least two consecutive suppressed 38% lower odds (aOR: 0.62, 95% CI: 0.58–0.66; p = 0.011) of
viral loads. attaining viral suppression, as compared to females.
Variable Univariate Multivariate
OR 95% CI p aOR 95% CI p The factors associated with adequate CD4+ cell count
Age (years) response, as shown in Table 3, were age and gender.
< 15 1 1 1 1 1 1
16–30 1.16 1.07–1.24 0.064 1.08 1.04–1.12 0.101 Multivariate analysis showed that the age group 31–45 years
31–45 1.31 1.18–1.33 0.031 1.14 1.05–1.20 0.046 had 10% higher odds (aOR: 1.10, 95% CI: 1.08–1.12; p = 0.01)
46–60 1.39 1.30–1.58 0.005 1.28 1.21–1.35 0.004 of attaining adequate immunological response, as compared
> 60 0.58 0.48–0.70 0.112 0.66 0.57–0.76 0.080 to those less than 15 years.
Marital status
Unmarried 1 1 1 1 1 1 Discussion
Married 0.53 0.48–0.59 0.131 0.73 0.69–0.79 0.083
Divorced 0.87 0.84–0.91 0.127 0.80 0.78–0.82 0.143 This study reviewed virologic and immunologic responses
Widowed 1.82 1.74–1.90 0.026 1.78 1.71–1.85 0.112 of patients, in a rural community health centre in Vhembe
Gender (male) 0.49 0.45–0.54 0.036 0.62 0.58–0.66 0.011 District, South Africa, to cART over a 132-month period. It
Baseline clinical stage found that most (78.4%) patients were initiated on cART
I 1 1 1 1 1 1 after 2010. This is probably because of changes in the
II 0.92 0.89–0.96 0.019 0.61 0.58–0.67 <0.001 South African NDoH guidelines since 2010, and the fact that
III 0.66 0.58–0.76 0.042 0.28 0.25–0.31 0.022
IV 0.54 0.50–0.60 0.063 0.26 0.18–0. 34 0.001 patients were being initiated in any clinic closer to their
Baseline haemoglobin (g/dL) 1.09 1.01–1.16 0.043 1.39 1.30–1.48 0.048 homes. This increased uptake into the antiretroviral therapy
Previous ARV exposure (exposed) 1.73 1.71–1.76 0.089 1.68 1.63–1.75 0.104 programme. 21
Baseline CD4 count (per 10 cells/µL) 1.34 1.29–1.40 0.143 1.12 1.08–1.16 0.108
Duration on HAART (months) 0.76 0.71–0.84 0.181 1.98 1.92–2.04 0.099 Furthermore, more females were initiated on HAART than
ARV, antiretroviral; HAART, highly active antiretroviral therapy; OR, odds ratio; aOR, adjusted males and most people in the cohort were aged 16–44 years.
odds ratio; CI, confidence interval.
22
Johnson et al. found that women seemed to have more
access to HAART than men and children. This is because
TABLE 3: Factors associated with adequate immunologic response.
Variable Univariate Multivariate pregnancy and breastfeeding are used as entry points for
OR 95% CI p aOR 95% CI p women by testing for HIV and initiation on cART. Presently,
Age (years) no such entry point exists for men and most children.
< 15 1 1 1 1 1 1
16–30 1.03 1.01–1.05 0.001 1.03 1.01–1.05 0.001 Our study also showed that only 0.9% of the cohort had any
31–45 1.14 1.10–1.18 0.008 1.10 1.08–1.12 0.010 form of previous antiretroviral exposure. This proportion is
46–60 1.10 1.04–1.17 0.021 1.07 1.04–1.11 0.047 quite low, considering that the guidelines recommending
> 60 0.92 0.88–0.95 0.057 0.99 0.96–1.02 0.133 PEP have been available for more than 6 years. This may
Marital status contribute to the high incidence of HIV in South Africa as,
Unmarried 1 1 1 1 1 1 although PEP is not 100% effective, it has been shown to
Married 1.34 1.14–1.57 0.110 1.44 1.26–1.64 0.133 23
Divorced 1.73 1.44–2.10 0.171 1.21 1.19–1.23 0.017 reduce HIV transmission in non-occupational exposures.
Widowed 2.02 1.79–2.28 0.121 2.47 2.27–2.68 0.101 However, data for previous exposure to PEP were obtained
Gender (female) 1.44 1.26–1.64 0.004 1.38 1.26–1.48 <0.001 by recall of patients before being stored into the electronic
Baseline clinical stage database. Also, during transfer into the health facility,
I 1 1 1 1 1 1 information on PEP was missing for some patients. This may
II 0.99 0.99–0.99 0.103 1.81 1.68–1.97 0.077 account for the low prevalence of PEP exposure.
III 0.80 0.78–0.83 0.142 0.91 0.86–1.04 0.183
IV 0.88 0.80–0.97 0.101 1.08 0.98–1.13 0.073 The results of this study showed a pattern in which the
Baseline haemoglobin (g/dL) 0.89 0.73–1.06 0.183 0.93 0.80–1.08 0.114 proportion of virally suppressed individuals increased with
Previous ARV exposure (exposed) 3.47 3.22–3.54 0.198 2.88 2.80–2.93 0.085 the passage of time. Also, the data recorded for individuals in
Duration on HAART (months) 1.73 1.48–2.14 0.108 1.66 1.58–1.70 0.199 this study also decreased consistently with time. This may
ARV, antiretroviral; HAART, highly active antiretroviral therapy; OR, odds ratio; aOR, adjusted
odds ratio; CI, confidence interval. have created a ‘retention bias’, which ensured that those who
http://www.sajhivmed.org.za 235 Open Access