
Page 241 - SAHCS HIVMed Journal Vol 20 No 1 2019
P. 241
Page 4 of 7 Original Research
who defaulted. Throughout the study, at least 98% of the (2.3%) had two or more VLs >1000 copies/mL at least
cohort were on a first-line regimen. There was no one on a 6 months apart and still remained on the failing regimen.
third-line regimen throughout the period under review.
Immunologic responses
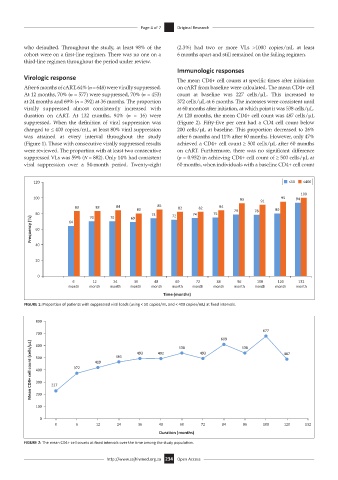
Virologic response The mean CD4+ cell counts at specific times after initiation
After 6 months of cART, 64% (n = 648) were virally suppressed. on cART from baseline were calculated. The mean CD4+ cell
At 12 months, 70% (n = 577) were suppressed, 70% (n = 453) count at baseline was 227 cells/µL. This increased to
at 24 months and 69% (n = 392) at 36 months. The proportion 372 cells/µL at 6 months. The increases were consistent until
virally suppressed almost consistently increased with at 60 months after initiation, at which point it was 538 cells/µL.
duration on cART. At 132 months, 94% (n = 16) were At 120 months, the mean CD4+ cell count was 487 cells/µL
suppressed. When the definition of viral suppression was (Figure 2). Fifty-five per cent had a CD4 cell count below
changed to ≤ 400 copies/mL, at least 80% viral suppression 200 cells/µL at baseline. This proportion decreased to 26%
was attained at every interval throughout the study after 6 months and 11% after 60 months. However, only 47%
(Figure 1). Those with consecutive virally suppressed results achieved a CD4+ cell count ≥ 500 cells/µL after 60 months
were reviewed. The proportion with at least two consecutive on cART. Furthermore, there was no significant difference
suppressed VLs was 59% (N = 882). Only 14% had consistent (p = 0.952) in achieving CD4+ cell count of ≥ 500 cells/µL at
viral suppression over a 54-month period. Twenty-eight 60 months, when individuals with a baseline CD4+ cell count
120 ≤50 ≤400
100
100 93 91 95 94
83 83 84 80 85 82 82 84 80
80 70 70 69 74 72 74 75 79 78
Frequency (%) 60 64
40
20
0
6 12 24 36 48 60 72 84 96 108 120 132
month month month month month month month month month month month month
Time (months)
FIGURE 1: Proportion of patients with suppressed viral loads (using < 50 copies/mL and < 400 copies/mL) at fixed intervals.
800
677
700
609 538 487
Mean CD4+ cell count (cells/µL) 500 227 372 419 465
600
538
493
493
492
400
300
200
100
0
0 6 12 24 36 48 60 72 84 96 108 120 132
Dura on (months)
FIGURE 2: The mean CD4+ cell counts at fixed intervals over the time among the study population.
http://www.sajhivmed.org.za 234 Open Access