
Page 424 - HIVMED_v21_i1.indb
P. 424
Page 5 of 8 Original Research
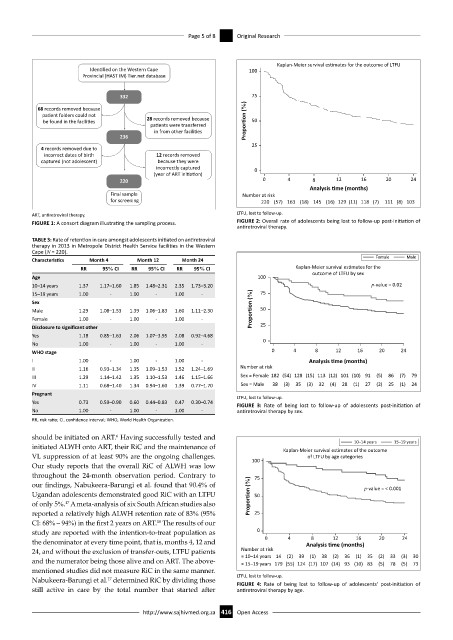
Kaplan-Meier survival es mates for the outcome of LTFU
Iden fied on the Western Cape 100
Provincial (HAST IM) Tier.net database
332 75
68 records removed because
pa ent folders could not
be found in the facili es 28 records removed because Propor on (%) 50
pa ents were transferred
in from other facili es
236
25
4 records removed due to
incorrect dates of birth 12 records removed
captured (not adolescent) because they were
incorrectly captured 0
(year of ART ini a on)
220 0 4 8 12 16 20 24
Analysis me (months)
Final sample Number at risk
for screening 220 (57) 163 (18) 145 (16) 129 (11) 118 (7) 111 (8) 103
ART, antiretroviral therapy. LTFU, lost to follow-up.
FIGURE 1: A consort diagram illustrating the sampling process. FIGURE 2: Overall rate of adolescents being lost to follow-up post-initiation of
antiretroviral therapy.
TABLE 3: Rate of retention in care amongst adolescents initiated on antiretroviral
therapy in 2013 in Metropole District Health Service facilities in the Western
Cape (N = 220).
Characteristics Month 4 Month 12 Month 24 Female Male
RR 95% CI RR 95% CI RR 95% CI Kaplan-Meier survival es mates for the
Age 100 outcome of LTFU by sex
10–14 years 1.37 1.17–1.60 1.85 1.48–2.31 2.35 1.73–3.20 p-value = 0.02
15–19 years 1.00 - 1.00 - 1.00 - 75
Sex
Male 1.29 1.08–1.53 1.39 1.06–1.83 1.60 1.11–2.30 Proportion (%) 50
Female 1.00 - 1.00 - 1.00 -
Disclosure to significant other 25
Yes 1.18 0.85–1.63 2.06 1.07–3.95 2.08 0.92–4.68
No 1.00 - 1.00 - 1.00 - 0
WHO stage 0 4 8 12 16 20 24
I 1.00 - 1.00 - 1.00 - Analysis me (months)
II 1.16 0.93–1.34 1.35 1.09–1.53 1.52 1.24–1.69 Number at risk
III 1.29 1.14–1.42 1.35 1.10–1.53 1.46 1.15–1.66 Sex = Female 182 (54) 128 (15) 113 (12) 101 (10) 91 (5) 86 (7) 79
IV 1.11 0.68–1.40 1.34 0.94–1.60 1.39 0.77–1.70 Sex = Male 38 (3) 35 (3) 32 (4) 28 (1) 27 (2) 25 (1) 24
Pregnant
LTFU, lost to follow-up.
Yes 0.73 0.59–0.90 0.60 0.44–0.83 0.47 0.30–0.74 FIGURE 3: Rate of being lost to follow-up of adolescents post-initiation of
No 1.00 - 1.00 - 1.00 - antiretroviral therapy by sex.
RR, risk ratio; CI, confidence interval; WHO, World Health Organization.
should be initiated on ART. Having successfully tested and 10–14 years 15–19 years
6
initiated ALWH onto ART, their RiC and the maintenance of Kaplan-Meier survival estimates of the outcome
VL suppression of at least 90% are the ongoing challenges. 100 of LTFU by age categories
Our study reports that the overall RiC of ALWH was low
throughout the 24-month observation period. Contrary to 75
our findings, Nabukeera-Barungi et al. found that 90.4% of p-value = < 0.001
Ugandan adolescents demonstrated good RiC with an LTFU Proportion (%) 50
of only 5%. A meta-analysis of six South African studies also
17
reported a relatively high ALWH retention rate of 83% (95% 25
CI: 68% – 94%) in the first 2 years on ART. The results of our
18
study are reported with the intention-to-treat population as 0
12
16
8
the denominator at every time point, that is, months 4, 12 and 0 4 Analysis me (months) 20 24
24, and without the exclusion of transfer-outs, LTFU patients Number at risk (2) 39 (1) 38 (2) 36 (1) 35 (2) 33 (3) 30
= 10–14 years14
and the numerator being those alive and on ART. The above- = 15–19 years 179 (55) 124 (17) 107 (14) 93 (10) 83 (5) 78 (5) 73
mentioned studies did not measure RiC in the same manner.
Nabukeera-Barungi et al. determined RiC by dividing those LTFU, lost to follow-up.
17
FIGURE 4: Rate of being lost to follow-up of adolescents’ post-initiation of
still active in care by the total number that started after antiretroviral therapy by age.
http://www.sajhivmed.org.za 416 Open Access