
Page 423 - HIVMED_v21_i1.indb
P. 423
Page 4 of 8 Original Research
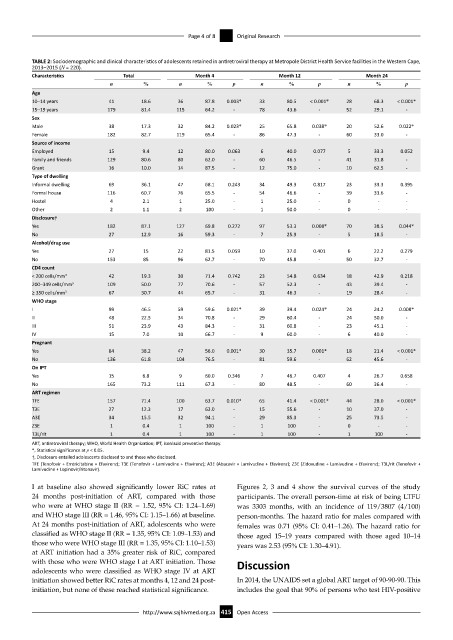
TABLE 2: Sociodemographic and clinical characteristics of adolescents retained in antiretroviral therapy at Metropole District Health Service facilities in the Western Cape,
2013–2015 (N = 220).
Characteristics Total Month 4 Month 12 Month 24
n % n % p n % p n % p
Age
10–14 years 41 18.6 36 87.8 0.003* 33 80.5 < 0.001* 28 68.3 < 0.001*
15–19 years 179 81.4 115 64.2 - 78 43.6 - 52 29.1 -
Sex
Male 38 17.3 32 84.2 0.023* 25 65.8 0.038* 20 52.6 0.022*
Female 182 82.7 119 65.4 - 86 47.3 - 60 33.0 -
Source of income
Employed 15 9.4 12 80.0 0.063 6 40.0 0.077 5 33.3 0.052
Family and friends 129 80.6 80 62.0 - 60 46.5 - 41 31.8 -
Grant 16 10.0 14 87.5 - 12 75.0 - 10 62.5 -
Type of dwelling
Informal dwelling 69 36.1 47 68.1 0.243 34 49.3 0.817 23 33.3 0.395
Formal house 116 60.7 76 65.5 - 54 46.6 - 39 33.6 -
Hostel 4 2.1 1 25.0 - 1 25.0 - 0 - -
Other 2 1.1 2 100 - 1 50.0 - 0 - -
Disclosure†
Yes 182 87.1 127 69.8 0.272 97 53.3 0.008* 70 38.5 0.044*
No 27 12.9 16 59.3 - 7 25.9 - 5 18.5 -
Alcohol/drug use
Yes 27 15 22 81.5 0.059 10 37.0 0.401 6 22.2 0.279
No 153 85 96 62.7 - 70 45.8 - 50 32.7 -
CD4 count
< 200 cells/mm 3 42 19.3 30 71.4 0.742 23 54.8 0.634 18 42.9 0.218
200–349 cells/mm 3 109 50.0 77 70.6 - 57 52.3 - 43 39.4 -
≥ 350 cells/mm 3 67 30.7 44 65.7 - 31 46.3 - 19 28.4 -
WHO stage
I 99 46.5 59 59.6 0.021* 39 39.4 0.024* 24 24.2 0.008*
II 48 22.5 34 70.8 - 29 60.4 - 24 50.0 -
III 51 23.9 43 84.3 - 31 60.8 - 23 45.1 -
IV 15 7.0 10 66.7 - 9 60.0 - 6 40.0 -
Pregnant
Yes 84 38.2 47 56.0 0.001* 30 35.7 0.001* 18 21.4 < 0.001*
No 136 61.8 104 76.5 - 81 59.6 - 62 45.6 -
On IPT
Yes 15 6.8 9 60.0 0.346 7 46.7 0.407 4 26.7 0.658
No 165 73.2 111 67.3 - 80 48.5 - 60 36.4 -
ART regimen
TFE 157 71.4 100 63.7 0.010* 65 41.4 < 0.001* 44 28.0 < 0.001*
T3E 27 12.3 17 63.0 - 15 55.6 - 10 37.0 -
A3E 34 15.5 32 94.1 - 29 85.3 - 25 73.5 -
Z3E 1 0.4 1 100 - 1 100 - 0 - -
T3L/rit 1 0.4 1 100 - 1 100 - 1 100 -
ART, antiretroviral therapy; WHO, World Health Organization; IPT, isoniazid preventive therapy.
*, Statistical significance at p < 0.05.
†, Disclosure entailed adolescents disclosed to and those who disclosed.
TFE (Tenofovir + Emtricitabine + Efavirenz); T3E (Tenofovir + Lamivudine + Efavirenz); A3E (Abacavir + Lamivudine + Efavirenz); Z3E (Zidovudine + Lamivudine + Efavirenz); T3L/rit (Tenofovir +
Lamivudine + Lopinovir/ritonavir).
I at baseline also showed significantly lower RiC rates at Figures 2, 3 and 4 show the survival curves of the study
24 months post-initiation of ART, compared with those participants. The overall person-time at risk of being LTFU
who were at WHO stage II (RR = 1.52, 95% CI: 1.24–1.69) was 3303 months, with an incidence of 119/3807 (4/100)
and WHO stage III (RR = 1.46, 95% CI: 1.15–1.66) at baseline. person-months. The hazard ratio for males compared with
At 24 months post-initiation of ART, adolescents who were females was 0.71 (95% CI: 0.41–1.26). The hazard ratio for
classified as WHO stage II (RR = 1.35, 95% CI: 1.09–1.53) and those aged 15–19 years compared with those aged 10–14
those who were WHO stage III (RR = 1.35, 95% CI: 1.10–1.53) years was 2.53 (95% CI: 1.30–4.91).
at ART initiation had a 35% greater risk of RiC, compared
with those who were WHO stage I at ART initiation. Those Discussion
adolescents who were classified as WHO stage IV at ART
initiation showed better RiC rates at months 4, 12 and 24 post- In 2014, the UNAIDS set a global ART target of 90-90-90. This
initiation, but none of these reached statistical significance. includes the goal that 90% of persons who test HIV-positive
http://www.sajhivmed.org.za 415 Open Access