
Page 222 - HIVMED_v21_i1.indb
P. 222
Page 4 of 9 Original Research
TABLE 2: Socio-demographic and categorical variables of the study participants.
Socio-demographics Study participants (n = 17) Control group (n = 17)
Median IQR n % Median IQR n %
Age in years 38 35–42 - - 38 35–42 - -
BMI 25 21–25 - - 25 21–25 - -
Duration of ART treatment years 5 3–5 - - 0 0 - -
Duration of haemodialysis in years 3 3–4 - - 6 3–6 - -
Sex
Male - - 9 53 - - 9 53
Female - - 8 47 - - 8 47
Comorbidities
Hypertension - - 17 100 - - 16 94
Diabetes mellitus - - 0 0 - - 1 6
Social history
Reported smoking - - 0 0 - - 0 0
Reported alcohol use - - 0 0 - - 0 0
Reported recreational drug use - - 0 0 - - 0 0
Chronic infections
Mycobacterium tuberculosis - - 0 0 - - 0 0
Hepatitis B - - 1 0.1 - - 0 0
Cause for renal failure
Hypertension - - 14 82 - - 16 94
Diabetes mellitus - - 0 0 - - 1 6
HIVAN - - 2 12 - - 0 0
Other - - 1 0.1 - - 0 0
BMI, body mass index; ART, antiretroviral therapy; HIVAN, HIV-associated nephropathy; IQR, interquartile range.
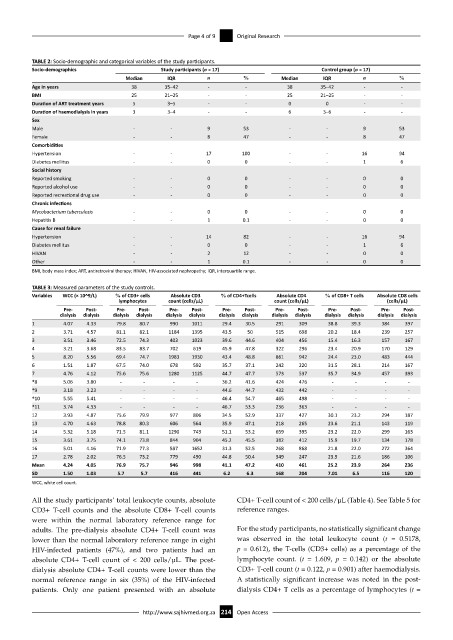
TABLE 3: Measured parameters of the study controls.
Variables WCC (× 10^9/L) % of CD3+ cells Absolute CD3 % of CD4+Tcells Absolute CD4 % of CD8+ T cells Absolute CD8 cells
lymphocytes count (cells/µL) count (cells/µL) (cells/µL)
Pre- Post- Pre- Post- Pre- Post- Pre- Post- Pre- Post- Pre- Post- Pre- Post-
dialysis dialysis dialysis dialysis dialysis dialysis dialysis dialysis dialysis dialysis dialysis dialysis dialysis dialysis
1 4.07 4.33 79.8 80.7 990 1011 29.4 30.5 291 309 38.8 39.3 384 397
2 3.71 4.57 81.1 82.1 1184 1395 43.5 50 515 698 20.2 18.4 239 257
3 3.51 3.46 72.5 74.3 403 1023 39.6 44.6 404 456 15.4 16.3 157 167
4 3.21 3.68 83.5 83.7 702 619 45.9 47.8 322 296 23.4 20.9 170 129
5 8.20 5.56 69.4 74.7 1983 1930 43.4 48.8 861 942 24.4 23.0 483 444
6 1.51 1.87 67.5 74.0 678 592 35.7 37.1 242 220 31.5 28.1 214 167
7 4.76 4.12 75.6 75.6 1280 1125 44.7 47.7 573 537 35.7 34.9 457 393
*8 5.06 3.80 - - - - 36.2 41.6 424 476 - - - -
*9 3.18 3.23 - - - - 44.6 44.7 432 442 - - - -
*10 5.55 5.41 - - - - 46.4 54.7 465 498 - - - -
*11 3.74 4.33 - - - - 46.7 53.3 236 363 - - - -
12 3.93 4.87 75.6 79.9 977 806 34.5 52.9 337 427 30.1 23.2 294 187
13 4.70 4.63 78.8 80.3 606 564 35.9 47.1 218 265 23.6 21.1 143 119
14 5.32 5.18 71.5 81.1 1290 743 51.1 53.2 659 395 23.2 22.0 299 163
15 3.61 3.75 74.1 73.8 844 904 45.2 45.5 382 412 15.9 19.7 134 178
16 5.01 4.16 71.9 77.3 587 1652 31.3 52.5 268 868 21.8 22.0 272 364
17 2.78 2.02 76.5 73.2 779 490 44.8 50.4 349 247 23.9 21.6 186 106
Mean 4.24 4.05 76.9 75.7 946 998 41.1 47.2 410 461 25.2 23.9 264 236
SD 1.50 1.03 5.7 5.7 416 441 6.2 6.3 168 204 7.01 6.5 116 120
WCC, white cell count.
All the study participants’ total leukocyte counts, absolute CD4+ T-cell count of < 200 cells/µL (Table 4). See Table 5 for
CD3+ T-cell counts and the absolute CD8+ T-cell counts reference ranges.
were within the normal laboratory reference range for
adults. The pre-dialysis absolute CD4+ T-cell count was For the study participants, no statistically significant change
lower than the normal laboratory reference range in eight was observed in the total leukocyte count (t = 0.5178,
HIV-infected patients (47%), and two patients had an p = 0.612), the T-cells (CD3+ cells) as a percentage of the
absolute CD4+ T-cell count of < 200 cells/µL. The post- lymphocyte count. (t = 1.609, p = 0.142) or the absolute
dialysis absolute CD4+ T-cell counts were lower than the CD3+ T-cell count (t = 0.122, p = 0.901) after haemodialysis.
normal reference range in six (35%) of the HIV-infected A statistically significant increase was noted in the post-
patients. Only one patient presented with an absolute dialysis CD4+ T cells as a percentage of lymphocytes (t =
http://www.sajhivmed.org.za 214 Open Access