
Page 223 - HIVMED_v21_i1.indb
P. 223
Page 5 of 9 Original Research
TABLE 4: Measured parameters of the study participants.†
Variables WCC (× 10^9/L) % of CD3+ cells Absolute CD3 count % of CD4+ T cells Absolute CD4 % of CD8+ T cells Absolute CD8
lymphocytes (cells/µL) count (cells/µL) cells (cells/µL)
Pre- Post- Pre- Post- Pre- Post- Pre- Post- Pre- Post- Pre- Post- Pre- Post-
dialysis dialysis dialysis dialysis dialysis dialysis dialysis dialysis dialysis dialysis dialysis dialysis dialysis dialysis
1 5.24 4.43 78.4 83.5 575 652 24.7 29.6 181 231 50.4 51.1 370 399
2 2.74 2.85 82.3 83.6 546 777 31.5 37.2 209 346 49.6 44.9 330 417
3 5.11 3.6 73.3 75.6 1174 720 24.1 29.8 387 284 48.4 44.5 778 424
4 5.38 3.96 84.4 86.5 740 813 39.3 40 345 376 44.2 43.7 388 411
5 6.52 5.86 71.5 75.7 609 584 38.0 47.4 324 366 31.4 27.3 267 211
6 6.97 6.47 73.1 79.5 1009 690 10.0 15.2 139 132 57.5 58.8 794 511
7 4.12 6.88 78.5 78.0 777 1400 40.8 43.7 404 785 34.8 31.9 345 574
†8 2.94 2.95 - - - - 29.8 32.7 227 281 - - - -
†9 3.95 3.94 - - - - 25.0 29.6 260 328 - - - -
†10 3.25 3.80 - - - - 38.4 44.2 414 521 - - - -
†11 5.30 6.07 - - - - 28.2 36.5 222 330 - - - -
12 6.88 6.63 78.8 82.9 1905 1734 38.4 46.6 929 975 37.2 33.3 901 697
13 3.65 4.2 82.1 83.5 834 980 27 36.4 274 428 51.8 43.9 526 515
14 5.86 5.17 79.1 87.5 1576 1270 44.5 54 888 784 27.0 27.1 538 393
15 3.63 3.07 75.2 75.5 766 765 33.8 34.4 349 357 40.3 39.4 416 408
16 5.62 5.26 73.4 77.3 770 870 44.6 50.4 483 564 27.3 26.9 287 301
17 7.11 7.03 78.3 78.6 1390 1294 29.8 30.0 538 544 46.7 43.2 843 750
Mean 4.69 4.83 77.5 80.2 974 965 32.23 37.51 386.6 448.9 42.05 39.69 521.8 462.4
SD 1.81 1.44 4.01 4.6 420 350 8.9 9.6 223.9 227 9.8 9.87 228.6 ±147.9
WCC, white cell count.
†, CD8%, CD3% and absolute counts not collected.
TABLE 5: Internally established laboratory reference ranges for leucocyte count, percentage and absolute lymphocyte subsets.
Variable WCC (× 10^9/L) CD3+ T-cell % CD3+ T cells CD4+ T-cell % CD4+ T cells CD8+ T-cell % CD8+ T cells
count (cells/µL) count (cells/µL) count (cells/µL)
Reference range 2.5–10.40 527–2846 59–81 332–1642 28–51 170–811 12–38
WCC, white cell count.
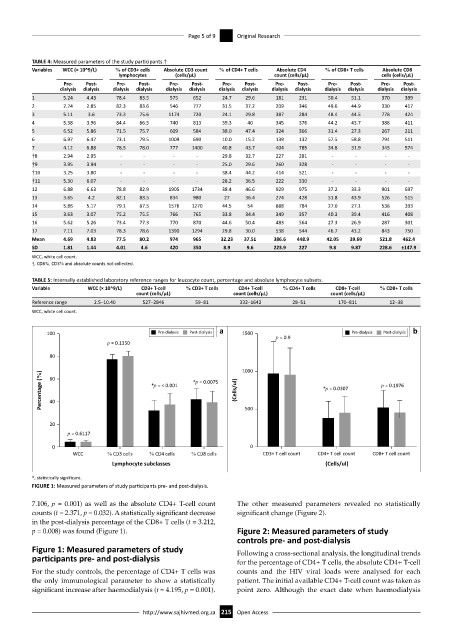
100 Pre-dialysis Post-dialysis a 1500 Pre-dialysis Post-dialysis b
p = 0.9
p = 0.1350
80
1000
Percentage (%) 40 *p = < 0.001 *p = 0.0075 (Cells/ul) *p = 0.0307 p = 0.1976
60
20 500
p = 0.6117
0 0
WCC % CD3 cells % CD4 cells % CD8 cells CD3+ T cell count CD4+ T cell count CD8+ T cell count
Lymphocyte subclasses (Cells/ul)
*, statistically significant.
FIGURE 1: Measured parameters of study participants pre- and post-dialysis.
7.106, p = 0.001) as well as the absolute CD4+ T-cell count The other measured parameters revealed no statistically
counts (t = 2.371, p = 0.032). A statistically significant decrease significant change (Figure 2).
in the post-dialysis percentage of the CD8+ T cells (t = 3.212,
p = 0.008) was found (Figure 1). Figure 2: Measured parameters of study
controls pre- and post-dialysis
Figure 1: Measured parameters of study Following a cross-sectional analysis, the longitudinal trends
participants pre- and post-dialysis for the percentage of CD4+ T cells, the absolute CD4+ T-cell
For the study controls, the percentage of CD4+ T cells was counts and the HIV viral loads were analysed for each
the only immunological parameter to show a statistically patient. The initial available CD4+ T-cell count was taken as
significant increase after haemodialysis (t = 4.195, p = 0.001). point zero. Although the exact date when haemodialysis
http://www.sajhivmed.org.za 215 Open Access