
Page 165 - HIVMED_v21_i1.indb
P. 165
Page 3 of 8 Original Research
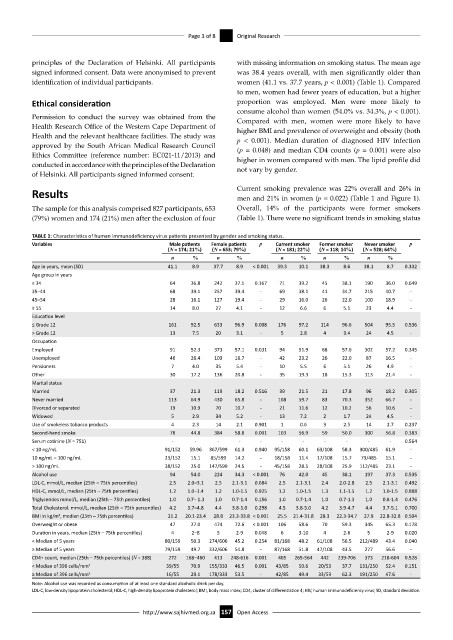
principles of the Declaration of Helsinki. All participants with missing information on smoking status. The mean age
signed informed consent. Data were anonymised to prevent was 38.4 years overall, with men significantly older than
identification of individual participants. women (41.1 vs. 37.7 years, p < 0.001) (Table 1). Compared
to men, women had fewer years of education, but a higher
Ethical consideration proportion was employed. Men were more likely to
consume alcohol than women (54.0% vs. 34.3%, p < 0.001).
Permission to conduct the survey was obtained from the Compared with men, women were more likely to have
Health Research Office of the Western Cape Department of higher BMI and prevalence of overweight and obesity (both
Health and the relevant healthcare facilities. The study was p < 0.001). Median duration of diagnosed HIV infection
approved by the South African Medical Research Council (p = 0.048) and median CD4 counts (p = 0.001) were also
Ethics Committee (reference number: EC021-11/2013) and
conducted in accordance with the principles of the Declaration higher in women compared with men. The lipid profile did
not vary by gender.
of Helsinki. All participants signed informed consent.
Results Current smoking prevalence was 22% overall and 26% in
men and 21% in women (p = 0.022) (Table 1 and Figure 1).
The sample for this analysis comprised 827 participants, 653 Overall, 14% of the participants were former smokers
(79%) women and 174 (21%) men after the exclusion of four (Table 1). There were no significant trends in smoking status
TABLE 1: Characteristics of human immunodeficiency virus patients presented by gender and smoking status.
Variables Male patients Female patients p Current smoker Former smoker Never smoker p
(N = 174; 21%) (N = 653; 79%) (N = 181; 22%) (N = 118; 14%) (N = 528; 64%)
n % n % n % n % n %
Age in years, mean (SD) 41.1 8.9 37.7 8.9 < 0.001 39.3 10.1 38.3 8.6 38.1 8.7 0.332
Age group in years
≤ 34 64 36.8 242 37.1 0.167 71 39.2 45 38.1 190 36.0 0.649
35–44 68 39.1 257 39.4 - 69 38.1 41 34.7 215 40.7 -
45–54 28 16.1 127 19.4 - 29 16.0 26 22.0 100 18.9 -
≥ 55 14 8.0 27 4.1 - 12 6.6 6 5.1 23 4.4 -
Education level
≤ Grade 12 161 92.5 633 96.9 0.008 176 97.2 114 96.6 504 95.5 0.536
> Grade 12 13 7.5 20 3.1 - 5 2.8 4 3.4 24 4.5 -
Occupation
Employed 91 52.3 373 57.1 0.031 94 51.9 68 57.6 302 57.2 0.345
Unemployed 46 26.4 109 16.7 - 42 23.2 26 22.0 87 16.5 -
Pensioners 7 4.0 35 5.4 - 10 5.5 6 5.1 26 4.9 -
Other 30 17.2 136 20.8 - 35 19.3 18 15.3 113 21.4 -
Marital status
Married 37 21.3 119 18.2 0.516 39 21.5 21 17.8 96 18.2 0.305
Never married 113 64.9 430 65.8 - 108 59.7 83 70.3 352 66.7 -
Divorced or separated 19 10.9 70 10.7 - 21 11.6 12 10.2 56 10.6 -
Widowed 5 2.9 34 5.2 - 13 7.2 2 1.7 24 4.5 -
Use of smokeless tobacco products 4 2.3 14 2.1 0.901 1 0.6 3 2.5 14 2.7 0.237
Second-hand smoke 78 44.8 384 58.8 0.001 103 56.9 59 50.0 300 56.8 0.383
Serum cotinine (N = 751) - - - - - - - - - - - 0.564
< 10 ng/mL 91/152 59.96 367/599 61.3 0.940 95/158 60.1 63/108 58.3 300/485 61.9 -
10 ng/mL – 100 ng/mL 23/152 15.1 85/599 14.2 - 18/158 11.4 17/108 15.7 73/485 15.1 -
> 100 ng/mL 38/152 25.0 147/599 24.5 - 45/158 28.5 28/108 25.9 112/485 23.1 -
Alcohol use 94 54.0 224 34.3 < 0.001 76 42.0 45 38.1 197 37.3 0.535
LDL-C, mmol/L, median (25th – 75th percentiles) 2.5 2.0–3.1 2.5 2.1-3.1 0.684 2.5 2.1-3.1 2.4 2.0-2.8 2.5 2.1-3.1 0.492
HDL-C, mmol/L, median (25th – 75th percentiles) 1.2 1.0–1.4 1.2 1.0-1.5 0.925 1.2 1.0-1.5 1.3 1.1-1.5 1.2 1.0-1.5 0.888
Triglycerides mmol/L, median (25th – 75th percentiles) 1.0 0.7– 1.3 1.0 0.7-1.4 0.156 1.0 0.7-1.4 1.0 0.7-1.3 1.0 0.8-1.4 0.476
Total Cholesterol, mmol/L, median (25th – 75th percentiles) 4.2 3.7–4.8 4.4 3.8-5.0 0.298 4.5 3.8-5.0 4.2 3.9-4.7 4.4 3.7-5.1 0.700
BMI in kg/m , median (25th – 75th percentiles) 21.2 20.1-23.4 28.8 23.3-33.8 < 0.001 25.5 21.4-31.8 28.3 22.3-34.7 27.9 22.8-32.8 0.504
2
Overweight or obese 47 27.0 474 72.6 < 0.001 106 58.6 70 59.3 345 65.3 0.178
Duration in years, median (25th – 75th percentiles) 4 2–8 5 2-9 0.048 6 3-10 4 2-6 5 2-9 0.020
< Median of 5 years 80/159 50.3 274/606 45.2 0.254 81/168 48.2 61/108 56.5 212/489 43.4 0.040
≥ Median of 5 years 79/159 49.7 332/606 54.8 - 87/168 51.8 47/108 43.5 277 56.6 -
CD4+ count, median (25th – 75th percentiles) (N = 388) 272 168–460 413 248-616 0.001 405 265-564 442 239-706 373 218-604 0.528
< Median of 396 cells/mm 3 39/55 70.9 155/333 46.5 0.001 43/85 50.6 20/53 37.7 131/250 52.4 0.151
≥ Median of 396 cells/mm 3 16/55 29.1 178/333 53.5 - 42/85 49.4 33/53 62.3 191/250 47.6 -
Note: Alcohol use was recorded as consumption of at least one standard alcoholic drink per day.
LDL-C, low-density lipoprotein cholesterol; HDL-C, high-density lipoprotein cholesterol; BMI, body mass index; CD4, cluster of differentiation 4; HIV, human immunodeficiency virus; SD, standard deviation.
http://www.sajhivmed.org.za 157 Open Access