Page 151 - HIVMED_v21_i1.indb
P. 151

Page 6 of 8  Original Research


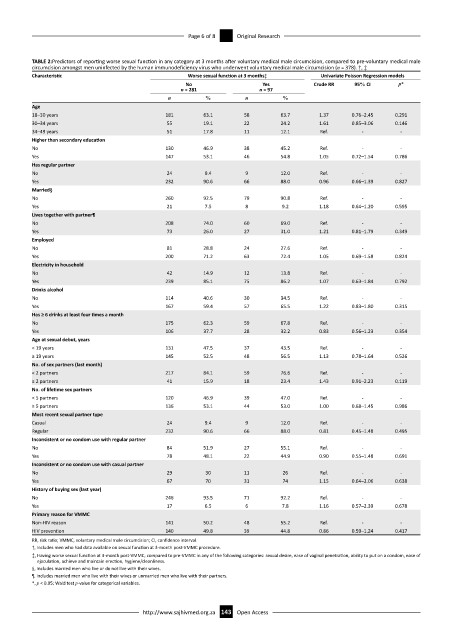
              TABLE 2:Predictors of reporting worse sexual function in any category at 3 months after voluntary medical male circumcision, compared to pre-voluntary medical male
              circumcision amongst men uninfected by the human immunodeficiency virus who underwent voluntary medical male circumcision (n = 378). †, ‡
              Characteristic                           Worse sexual function at 3 months‡  Univariate Poisson Regression models
                                                      No                  Yes           Crude RR  95% CI      p*
                                                     n = 281             n = 97
                                                 n         %          n         %
              Age
              18–30 years                        181       63.1      58        63.7      1.37     0.76–2.45  0.291
              30–34 years                        55        19.1      22        24.2      1.61     0.85–3.06  0.146
              34–49 years                        51        17.8      11        12.1      Ref.       -         -
              Higher than secondary education
              No                                 130       46.9      38        45.2      Ref.       -         -
              Yes                                147       53.1      46        54.8      1.05     0.72–1.54  0.786
              Has regular partner
              No                                 24        9.4        9        12.0      Ref.       -         -
              Yes                                232       90.6      66        88.0      0.96     0.66–1.39  0.827
              Married§
              No                                 260       92.5      79        90.8      Ref.       -         -
              Yes                                21        7.5        8        9.2       1.18     0.64–1.20  0.595
              Lives together with partner¶
              No                                 208       74.0      60        69.0      Ref.       -         -
              Yes                                73        26.0      27        31.0      1.21     0.81–1.79  0.349
              Employed
              No                                 81        28.8      24        27.6      Ref.       -         -
              Yes                                200       71.2      63        72.4      1.05     0.69–1.58  0.824
              Electricity in household
              No                                 42        14.9      12        13.8      Ref.       -         -
              Yes                                239       85.1      75        86.2      1.07     0.63–1.84  0.792
              Drinks alcohol
              No                                 114       40.6      30        34.5      Ref.       -         -
              Yes                                167       59.4      57        65.5      1.22     0.83–1.80  0.315
              Has ≥ 6 drinks at least four times a month
              No                                 175       62.3      59        67.8      Ref.       -         -
              Yes                                106       37.7      28        32.2      0.83     0.56–1.23  0.354
              Age at sexual debut, years
              < 19 years                         131       47.5      37        43.5      Ref.       -         -
              ≥ 19 years                         145       52.5      48        56.5      1.13     0.78–1.64  0.526
              No. of sex partners (last month)
              < 2 partners                       217       84.1      59        76.6      Ref.       -         -
              ≥ 2 partners                       41        15.9      18        23.4      1.43     0.91–2.23  0.119
              No. of lifetime sex partners
              < 5 partners                       120       46.9      39        47.0      Ref.       -         -
              ≥ 5 partners                       136       53.1      44        53.0      1.00     0.68–1.45  0.986
              Most recent sexual partner type
              Casual                             24        9.4        9        12.0      Ref.       -         -
              Regular                            232       90.6      66        88.0      0.81     0.45–1.48  0.495
              Inconsistent or no condom use with regular partner
              No                                 84        51.9      27        55.1      Ref.       -         -
              Yes                                78        48.1      22        44.9      0.90     0.55–1.48  0.691
              Inconsistent or no condom use with casual partner
              No                                 29        30        11         26       Ref.       -         -
              Yes                                67        70        31         74       1.15     0.64–2.06  0.638
              History of buying sex (last year)
              No                                 246       93.5      71        92.2      Ref.       -         -
              Yes                                17        6.5        6        7.8       1.16     0.57–2.39  0.678
              Primary reason for VMMC
              Non-HIV reason                     141       50.2      48        55.2      Ref.       -         -
              HIV prevention                     140       49.8      39        44.8      0.86     0.59–1.24  0.417
              RR, risk ratio; VMMC, voluntary medical male circumcision; CI, confidence interval.
              †, Includes men who had data available on sexual function at 3-month post-VMMC procedure.
              ‡,  Having worse sexual function at 3-month post-VMMC, compared to pre-VMMC in any of the following categories: sexual desire, ease of vaginal penetration, ability to put on a condom, ease of
               ejaculation, achieve and maintain erection, hygiene/cleanliness.
              §, Includes married men who live or do not live with their wives.
              ¶, Includes married men who live with their wives or unmarried men who live with their partners.
              *, p < 0.05; Wald test p-value for categorical variables.


                                           http://www.sajhivmed.org.za 143  Open Access
   146   147   148   149   150   151   152   153   154   155   156