
Page 59 - SAHCS HIVMed Journal Vol 20 No 1 2019
P. 59
Page 4 of 10 Review Article
standardised a timeframe for mortality estimates, ranging Study Popula on LTFU (95 % CI)
from 1 to 4 years. Two (12.5%) were interventional studies. Of Adults
the total 19 cohorts reporting mortality at 1 year, the median Shearer 2014 Adults 10.71 (10.18, 11.25)
mortality was 9.6% (range 3.8% – 17.4%). Only three cohorts Cornell 2015 Adults 12.20 (11.98, 12.42)
14.01 (12.26, 15.86)
Clouse 2013(A)
Adults
reported mortality at 5 years with a median of 9.0% (range Grimsrud 2014 Adults 9.38 (8.60, 10.19)
11.21 (9.69, 12.82)
Wandeler
Adults
8.6% – 10.6%) (Online Appendix 2). Evangeli Adults 4.59 (2.72, 6.92)
Evans 2013 Adults 11.11 (10.81, 11.41)
Mberi Adults 9.65 (7.41, 12.15)
Of the 101 cohorts reporting LTFU, encompassed within the Subtotal 11.57 (11.40, 11.73)
67 studies, the median LTFU estimate was 12.8% (IQR 7.9% – Pregnancy
22.0%; range 0.2% – 43.1%); range of time for reporting was Clouse 2013 (B) Pregnancy 34.57 (25.34, 44.44)
23.27 (15.58, 31.96)
Pregnancy
Schwartz
3 months to 5 years. Of those 14 estimates in the lowest Van Schalkwyk Pregnancy 37.65 (31.77, 43.72)
33.04 (28.73, 37.35)
Subtotal
quartile (< 7.9% LTFU), four cohorts (28.6%) had n < 2000;
five (36.0%) had n < 5000. Eight (57%) were paediatric Children Children 7.58 (6.81, 8.39)
Sengayi
studies, and 1 (7%) was an adult interventional study. Half Chaagan Children 4.93 (2.07, 8.92)
7.45 (6.67, 8.22)
did not standardise their LTFU estimate; the other half Subtotal
estimated at 3 years or under. Of the 20 estimates in the 0 10 20 30 40
highest quartile (> 22% LTFU), 12 studies (60%) had n < 1000, % LTF
and 4 (20%) had n < 100; 2 (10%) studies were paediatric FIGURE 2: Meta-analysis of proportion of patients loss to follow-up at 1 year,
cohorts, 4 (20%) studies were pregnancy cohorts and 1 (5%) by study population.
study was an interventional pregnancy cohort. The timeline
for estimating LTFU ranged from 6 months to 3 years, with Study LTFU (95 % CI)
12 cohorts (60%) not reporting a standardised timeframe 3 months
(Online Appendix 2). Shearer 2014 10.71 (10.18, 11.25)
Clouse 2013 (A) 14.01 (12.26, 15.86)
The vast majority of studies had reliable data collection Evangeli 4.59 (2.72, 6.92)
(99%), an independent assessment of outcome (99%), and Evans 2013 11.11 (10.81, 11.41)
10.98 (10.72, 11.24)
Subtotal
reported mortality (96%); 75% of cohorts were deemed
definitely representative of the population, with only 9% 6 months
definitely not or unclear. In terms of follow-up, seven studies Cornell 2015 12.20 (11.98, 12.42)
(10%) had follow-up of greater than 3 years; the majority of Wandeler 11.21 (9.69, 12.82)
9.38 (8.60, 10.19)
Grimsrud 2014
studies had follow-up lengths between 1 and 3 years (n = 49; Mberi 9.65 (7.41, 12.15)
73%); seven studies (10%) had follow-up shorter than 1 year, Subtotal 11.96 (11.75, 12.17)
and four studies (6.0%) had follow-up of unclear length; 54%
of studies had complete data, while 30% of studies were Overall 11.57 (11.40, 11.73)
missing < 10% of data related to our primary outcomes, 10%
of studies were missing > 10% of data related to our primary 0 10 20 30 40
outcomes and 6% of studies did not state anything about the % LTF
missing data in the manuscript.
FIGURE 3: Meta-analysis of proportion of patients loss to follow-up at 1 year,
by loss to follow-up definition (3 months vs. 6 months).
Meta-analysis
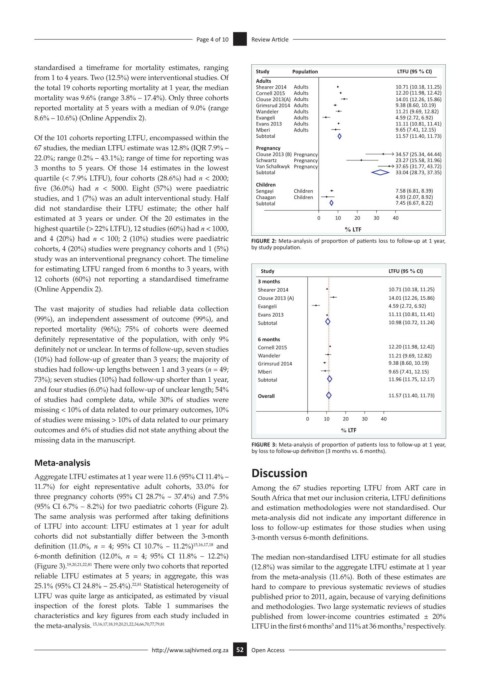
Aggregate LTFU estimates at 1 year were 11.6 (95% CI 11.4% – Discussion
11.7%) for eight representative adult cohorts, 33.0% for Among the 67 studies reporting LTFU from ART care in
three pregnancy cohorts (95% CI 28.7% – 37.4%) and 7.5% South Africa that met our inclusion criteria, LTFU definitions
(95% CI 6.7% – 8.2%) for two paediatric cohorts (Figure 2). and estimation methodologies were not standardised. Our
The same analysis was performed after taking definitions meta-analysis did not indicate any important difference in
of LTFU into account: LTFU estimates at 1 year for adult loss to follow-up estimates for those studies when using
cohorts did not substantially differ between the 3-month 3-month versus 6-month definitions.
definition (11.0%, n = 4; 95% CI 10.7% – 11.2%) 15,16,17,18 and
6-month definition (12.0%, n = 4; 95% CI 11.8% – 12.2%) The median non-standardised LTFU estimate for all studies
(Figure 3). 19,20,21,22,81 There were only two cohorts that reported (12.8%) was similar to the aggregate LTFU estimate at 1 year
reliable LTFU estimates at 5 years; in aggregate, this was from the meta-analysis (11.6%). Both of these estimates are
25.1% (95% CI 24.8% – 25.4%). 22,81 Statistical heterogeneity of hard to compare to previous systematic reviews of studies
LTFU was quite large as anticipated, as estimated by visual published prior to 2011, again, because of varying definitions
inspection of the forest plots. Table 1 summarises the and methodologies. Two large systematic reviews of studies
characteristics and key figures from each study included in published from lower-income countries estimated ± 20%
the meta-analysis. 15,16,17,18,19,20,21,22,34,66,70,77,79,81 LTFU in the first 6 months and 11% at 36 months, respectively.
5
3
http://www.sajhivmed.org.za 52 Open Access