
Page 332 - HIVMED_v21_i1.indb
P. 332
Page 3 of 5 Original Research
TABLE 1: Demographic and clinical characteristics of elderly patients receiving antiretroviral therapy at Newlands Clinic in March 2020, by sex.
Characteristic Females Males Total
n = 1008 % n = 680 % N = 1688 %
Baseline age in years, median (IQR) 46.5 41.2–51.4 46.8 42.7–52.1 46.6 42.1–51.8
Current age (years), median (IQR) 56 52–61 56 52–61 56 52–61
Current age in years, n (%)
50–60 729 72 491 72 1220 72
> 60–70 246 25 158 23 404 24
> 70 33 3 31 5 64 4
Marital status at enrolment
Married 308 31 556 82 864 51
Widowed 478 47 69 10 547 32
Divorced 74 7 27 4 101 6
Single 148 15 28 4 176 11
CD4 count in cells/µL, median (IQR) 526 390–689 377 390–689 464 327–628
HIV viral load expressed as RNA copies/mL, n (%)
< 50 939 93 617 91 1 756 92
50–1000 58 6 39 6 97 6
> 1000 9 1 21 3 30 2
Body mass index category, n (%)
Underweight 48 5 88 13 136 8
Normal 380 38 406 60 786 47
Overweight 319 32 133 18 452 27
Obese 251 25 48 7 299 18
ART duration, years, median (IQR) 11.3 8.1–14.1 10.4 8.1–14.1 10.9 7.1–13
Current ART regimen, n (%)
NNRTI† +2NRTI 144 14 97 14 241 14
TLD‡ 671 67 411 60 1 082 64
ATV/r§ or LPV/r¶ + 2NRTI 171 17 143 21 314 19
DTG†† + Darunavir + ≤ 2NRTI 17 2 28 4 45 3
Other regimens 5 0.5 1 0.2 6 0.3
ART, antiretroviral therapy; IQR, interquartile range; HIV, human immunodeficiency virus; RNA, ribonucleic acid; NNRTI, non-nucleoside reverse transcriptase inhibitors; NRTI, nucleoside reverse
transcriptase inhibitor; TLD, tenofovir, lamivudine and dolutegravir; ATV/r, atazanavir/ritonovir; LPV/r, Lopinavir/ritonovir; DTG, dolutegravir.
†, Either nevirapine or efavirenz.
‡, Tenofovir, lamivudine and dolutegravir.
§, Atazanavir/ritonavir.
¶, Lopinavir/ritonavir.
††, Dolutegravir.
TABLE 2: Distribution of comorbidities amongst elderly patients receiving
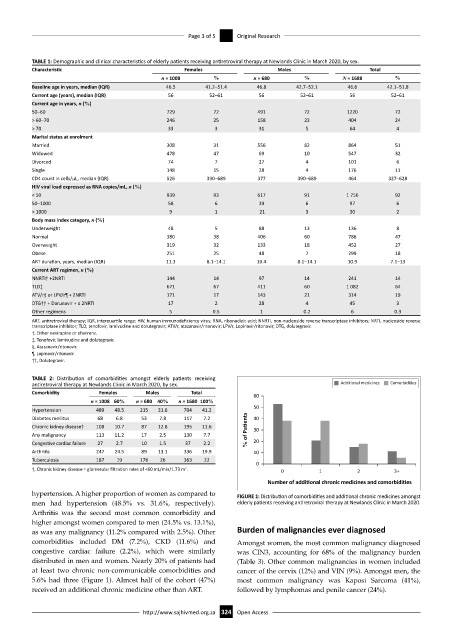
antiretroviral therapy at Newlands Clinic in March 2020, by sex. Addi onal medicines Comorbidi es
Comorbidity Females Males Total 60
n = 1008 60% n = 680 40% n = 1680 100%
Hypertension 489 48.5 215 31.6 704 41.2 50
Diabetes mellitus 68 6.8 53 7.8 117 7.2 40
Chronic kidney disease† 108 10.7 87 12.8 195 11.6 % of Pa ents 30
Any malignancy 113 11.2 17 2.5 130 7.7
Congestive cardiac failure 27 2.7 10 1.5 37 2.2 20
Arthritis 247 24.5 89 13.1 336 19.9 10
Tuberculosis 187 19 176 26 363 22
0
†, Chronic kidney disease = glomerular filtration rates of <60 mL/min/1.73 m . 2 0 1 2 3+
Number of addi onal chronic medicines and comorbidi es
hypertension. A higher proportion of women as compared to FIGURE 1: Distribution of comorbidities and additional chronic medicines amongst
men had hypertension (48.5% vs. 31.6%, respectively). elderly patients receiving antiretroviral therapy at Newlands Clinic in March 2020.
Arthritis was the second most common comorbidity and
higher amongst women compared to men (24.5% vs. 13.1%),
as was any malignancy (11.2% compared with 2.5%). Other Burden of malignancies ever diagnosed
comorbidities included DM (7.2%), CKD (11.6%) and Amongst women, the most common malignancy diagnosed
congestive cardiac failure (2.2%), which were similarly was CIN3, accounting for 68% of the malignancy burden
distributed in men and women. Nearly 20% of patients had (Table 3). Other common malignancies in women included
at least two chronic non-communicable comorbidities and cancer of the cervix (12%) and VIN (9%). Amongst men, the
5.6% had three (Figure 1). Almost half of the cohort (47%) most common malignancy was Kaposi Sarcoma (41%),
received an additional chronic medicine other than ART. followed by lymphomas and penile cancer (24%).
http://www.sajhivmed.org.za 324 Open Access