
Page 295 - HIVMED_v21_i1.indb
P. 295
Page 5 of 10 Original Research
p - 0.233 0.266 0.538 - 0.786 0.486 0.935 - 0.857 - 0.143 0.134 0.239 - 0.943 0.935 - 0.023* 0.649 - 0.828 0.662 0.363
AOR Ref 1.8 (0.7–4.9) 0.5 (0.1–1.8) 1.7 (0.3–8.8) Ref 1.2 (0.3–5.0) 1.7 (0.4–7.4) 0.9 (0.2–4.3) Ref 0.9 (0.4–2.1) Ref 2.0 (0.8–4.8) 2.2 (0.8–5.9) 2.7 (0.5–14.2) Ref 1.1 (0.3–4.1) 0.9 (0.2–5.1) Ref 2.5 (1.1–5.7) 1.3 (0.4–4.7) Ref 0.9 (0.3–2.6) 0.8 (0.3–2.3) 0.6 (0.2–1.9)
Side effects
p - 0.080 0.503 0.484 - 0.966 0.736 0.301 - 0.301 - 0.087 0.120 0.269 - 0.838 0.600 - 0.030* 0.699 - 0.771 0.513 0.262
2.1 (0.9–4.8) - 0.246 0.7 (0.2–2.2) 0.505 1.7 (0.4–7.0) 0.069 - 1.0 (0.3–3.6) 0.551 0.8 (0.2–3.0) 0.597 0.5 (0.1–1.9) 0.612 - 0.7 (0.3–1.4) 0.244 - 2.0 (0.9–4.5) 0.799 2.0 (0.8–4.9) 0.470 2.3 (0.5–9.7) 0.170 - 1.1 (0.3–3.7) 0.764 1.5 (0.3–7.0) 0.309 - 2.2 (1.1–4.3) 0.314 1.2 (0.4–3.8) 0.620 - 0.9 (0.3–2.3) 0.916 0.7 (0.3–1.9) 0.200 0.6 (0.2–1.5) 0.787
UOR Ref Ref Ref Ref Ref Ref Ref
Feeling that second-line regimen is difficult to take p AOR UOR Ref - Ref 1.7 (0.7–4.8) 0.037* 2.4 (1.1–5.6) 0.6 (0.2–2.4) 0.503 0.7 (0.2–2.2) 8.6 (0.8–87.7) 0.015* 15.0 (1.7–133.6) Ref - Ref 1.6 (0.3–7.6) 0.815 1.2 (0.3–4.6) 0.6 (0.1–3.2) 0.256 0.5 (0.1–1.8) 0.7 (0.1–3.3) 0.160 0.4 (0.1–1.5) Ref - Ref 0.6 (0.3–1.3) 0.073 0.5 (0.3–1.1) Ref - Ref 0.9 (0.4–2.2) 0.777 1.1 (0.5–2.5) 0.7 (0.2–1.9) 0.949 1.0 (0.4–2.3) 0.3 (0.04–1.8) 0.105 0.3 (0.05–1.
p
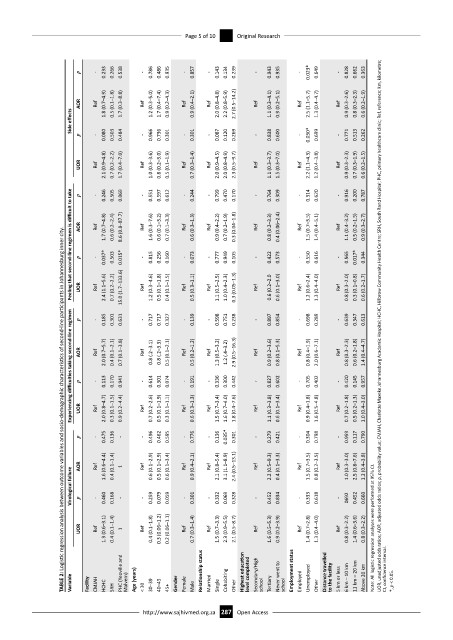
TABLE 2: Logistic regression analysis between outcome variables and socio-demographic characteristics of second-line participants in Johannesburg inner city.
Experiencing difficulties taking second-line regimen p p AOR - Ref - 0.185 2.0 (0.7–5.7) 0.113 0.301 0.4 (0.1–2.1) 0.170 0.631 0.7 (0.1–3.8) 0.941 - Ref - 0.717 0.8 (.2–3.1) 0.614 0.717 0.8 (.2–3.3) 0.301 0.327 0.5 (0.1–2.1) 0.074 - Ref - 0.139 0.5 (0.2–1.2) 0.191 - Ref - 0.598 1.3 (0.5–3.2) 0.336 0.751 1.2 (.4–3.2) 0.300 0.238 2.9 (0.5–16.3) 0.442 - Ref - 0.897 0.9 (0.2–3.6) 0.827 0.854 0.8 (0.1–5.3) 0.602 - Ref - 0.698 0.8 (0.4–1.9
p UOR Ref - 2.0 (0.8–4.7) 0.475 0.3 (0.1–1.5) 0.136 0.9 (0.2–4.4) - Ref - 0.7 (0.2–2.6) 0.496 0.5 (0.1–1.9) 0.462 0.3 (0.1–1.1) 0.595 Ref - 0.6 (0.3–1.3) 0.776 Ref - 1.5 (0.7–3.4) 0.136 1.6 (0.7–4.0) 0.035* 1.8 (0.4–7.6) 0.301 Ref - 1.1 (0.3–3.8) 0.279 0.6 (0.1–3.4) 0.421 Ref - 0.9 (0.4–1.8) 0.304 1.6 (0.5–4.8) 0.798 Ref - 0.7 (0.2–1.8) 0.959 0.5 (0.2–1.3) 0.117 1.0 (0.4–3.0) 0.790
AOR Ref 1.6 (0.6–4.4) 0.4 (0.1–1.4) 1 Ref 0.6 (0.1–2.9) 0.5 (0.1–2.9) 0.6 (0.1–3.4) Ref 0.9 (0.4–2.1) Ref 2.1 (0.8–5.4) 3.1 (1.1–8.9) 2.4 (0.5–13.1) Ref 2.2 (0.5–9.3) 0.4 (0.1–3.3) Ref 1.5 (0.7–3.5) 0.8 (0.2–3.5) Ref 1.0 (0.3–3.0) 2.5 (0.8–7.6) 1.2 (0.4–3.8)
Virological failure p - 0.460 0.168 - - 0.259 0.079 0.059 - 0.301 - 0.332 0.069 0.328 - 0.452 0.834 - 0.333 0.618 - 0692 0.452 0.660
UOR Ref 1.3 (0.6–3.1) 0.4 (0.1–1.4) 1 Ref 0.4 (0.1–1.8) 0.3 (0.06–1.2) 0.2 (0.06–1.1) Ref 0.7 (0.3–1.4) Ref 1.5 (0.7–3.3) 2.3 (0.9–5.5) 2.1 (0.5–8.7) Ref 1.6 (0.5–5.3) 0.9 (0.2–3.9) Ref 1.4 (0.7–2.8) 1.3 (0.4–4.0) Ref 0.8 (0.3–2.2) 1.4 (0.6–3.6) 0.8 (0.3–2.2) Note: All logistic regression analyses were performed at 95% CI.
PHC (Yeoville and Relationship status Highest education level completed Secondary/High Never went to Employment status Distance travelled to the facility 6 km – 10 km 11 km – 20 km Above 20 km CI, confidence interval.
Variable Facility CMJAH HCHC SRH Malvern) Age (years) < 30 30–39 40–45 45+ Gender Female Male Married Single Cohabiting Other school Tertiary school Employed Unemployed Other 5 km or less *, p < 0.05.
http://www.sajhivmed.org.za 287 Open Access