
Page 294 - HIVMED_v21_i1.indb
P. 294
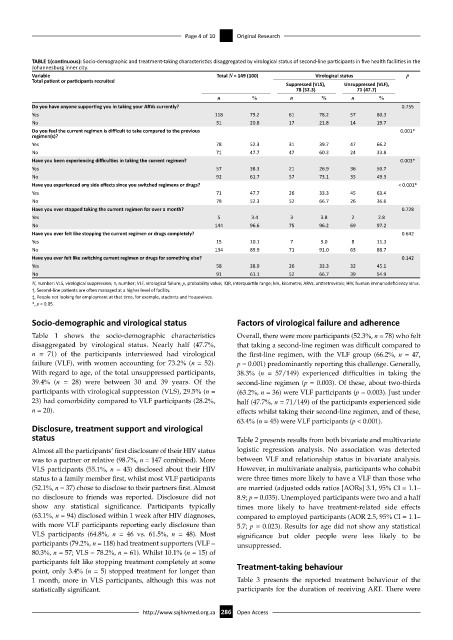
Page 4 of 10  Original Research


              TABLE 1(continuous): Socio-demographic and treatment-taking characteristics disaggregated by virological status of second-line participants in five health facilities in the
              Johannesburg inner city.
              Variable                                        Total N = 149 (100)       Virological status      p
              Total patient or participants recruited
                                                                                Suppressed (VLS),   Unsuppressed (VLF),
                                                                                   78 (52.3)       71 (47.7)
                                                              n         %         n       %       n      %
              Do you have anyone supporting you in taking your ARVs currently?                                 0.755
              Yes                                             118      79.2      61      78.2    57     80.3
              No                                              31       20.8      17      21.8    14     19.7
              Do you feel the current regimen is difficult to take compared to the previous                   0.001*
              regimen(s)?
              Yes                                             78       52.3      31      39.7    47     66.2
              No                                              71       47.7      47      60.3    24     33.8
              Have you been experiencing difficulties in taking the current regimen?                          0.003*
              Yes                                             57       38.3      21      26.9    36     50.7
              No                                              92       61.7      57      73.1    35     49.3
              Have you experienced any side effects since you switched regimens or drugs?                     < 0.001*
              Yes                                             71       47.7      26      33.3    45     63.4
              No                                              78       52.3      52      66.7    26     36.6
              Have you ever stopped taking the current regimen for over a month?                               0.728
              Yes                                             5        3.4        3       3.8     2      2.8
              No                                              144      96.6      75      96.2    69     97.2
              Have you ever felt like stopping the current regimen or drugs completely?                        0.642
              Yes                                             15       10.1       7       9.0     8     11.3
              No                                              134      89.9      71      91.0    63     88.7
              Have you ever felt like switching current regimen or drugs for something else?                   0.142
              Yes                                             58       38.9      26      33.3    32     45.1
              No                                              91       61.1      52      66.7    39     54.9
              N, number; VLS, virological suppression; n, number; VLF, virological failure; p, probability value; IQR, interquartile range; km, kilometre; ARVs, antiretrovirals; HIV, human immunodeficiency virus.
              †, Second-line patients are often managed at a higher level of facility.
              ‡, People not looking for employment at that time, for example, students and housewives.
              *, p < 0.05.

              Socio-demographic and virological status              Factors of virological failure and adherence
              Table 1 shows the socio-demographic characteristics   Overall, there were more participants (52.3%, n = 78) who felt
              disaggregated by virological status. Nearly half (47.7%,   that taking a second-line regimen was difficult compared to
              n  =  71) of the participants interviewed had virological   the first-line regimen, with the VLF group (66.2%,  n =  47,
              failure (VLF), with women accounting for 73.2% (n = 52).   p = 0.001) predominantly reporting this challenge. Generally,
              With regard to age, of the total unsuppressed participants,   38.3% (n =  57/149) experienced difficulties in taking the
              39.4% (n  =  28) were between 30 and 39 years. Of the   second-line regimen (p = 0.003). Of these, about two-thirds
              participants with virological suppression (VLS), 29.5% (n =   (63.2%, n = 36) were VLF participants (p = 0.003). Just under
              23) had comorbidity compared to VLF participants (28.2%,   half (47.7%, n = 71/149) of the participants experienced side
              n = 20).                                              effects whilst taking their second-line regimen, and of these,
                                                                    63.4% (n = 45) were VLF participants (p < 0.001).
              Disclosure, treatment support and virological
              status                                                Table 2 presents results from both bivariate and multivariate
              Almost all the participants’ first disclosure of their HIV status   logistic regression analysis. No association was detected
              was to a partner or relative (98.7%, n = 147 combined). More   between VLF and relationship status in bivariate analysis.
              VLS participants (55.1%, n = 43) disclosed about their HIV   However, in multivariate analysis, participants who cohabit
              status to a family member first, whilst most VLF participants   were three times more likely to have a VLF than those who
              (52.1%, n = 37) chose to disclose to their partners first. Almost   are married (adjusted odds ratios [AORs] 3.1, 95% CI = 1.1–
              no disclosure to friends was reported. Disclosure did not   8.9; p = 0.035). Unemployed participants were two and a half
              show  any statistical significance. Participants typically   times more likely to have treatment-related side effects
              (63.1%, n = 94) disclosed within 1 week after HIV diagnoses,   compared to employed participants (AOR 2.5, 95% CI = 1.1–
              with more VLF participants reporting early disclosure than   5.7; p = 0.023). Results for age did not show any statistical
              VLS participants (64.8%,  n =  46 vs. 61.5%,  n =  48). Most   significance  but  older  people  were  less  likely  to  be
              participants (79.2%, n = 118) had treatment supporters (VLF =   unsuppressed.
              80.3%, n = 57; VLS = 78.2%, n = 61). Whilst 10.1% (n = 15) of
              participants felt like stopping treatment completely at some   Treatment-taking behaviour
              point, only 3.4% (n  =  5) stopped treatment for longer than
              1  month, more in VLS participants, although this was not   Table 3 presents the reported treatment behaviour of the
              statistically significant.                            participants for the duration of receiving ART. There were

                                           http://www.sajhivmed.org.za 286  Open Access