
Page 256 - HIVMED_v21_i1.indb
P. 256
Page 3 of 4 Scientific Letter
Immunological non-responders CD4 test recorded. Considering that amongst those who did
access CD4 testing, CD4 count was below 200 cells/mm in
3
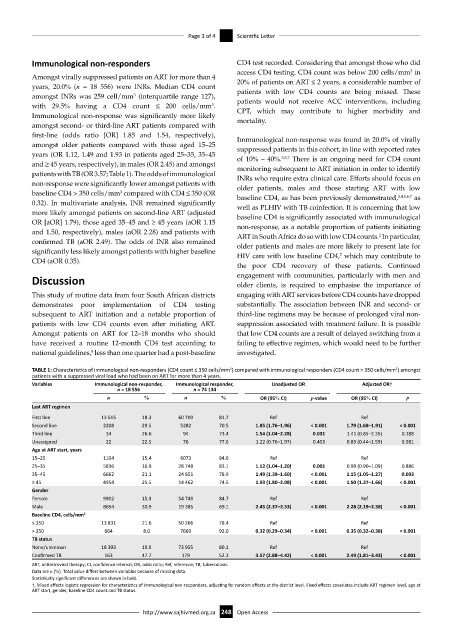
Amongst virally suppressed patients on ART for more than 4 20% of patients on ART ≤ 2 years, a considerable number of
years, 20.0% (n = 18 556) were INRs. Median CD4 count
amongst INRs was 259 cell/mm (interquartile range 127), patients with low CD4 counts are being missed. These
3
with 29.5% having a CD4 count ≤ 200 cells/mm . patients would not receive ACC interventions, including
3
Immunological non-response was significantly more likely CPT, which may contribute to higher morbidity and
mortality.
amongst second- or third-line ART patients compared with
first-line (odds ratio [OR] 1.85 and 1.54, respectively), Immunological non-response was found in 20.0% of virally
amongst older patients compared with those aged 15–25 suppressed patients in this cohort, in line with reported rates
years (OR 1.12, 1.49 and 1.93 in patients aged 25–35, 35–45 of 10% – 40%. 3,5,7 There is an ongoing need for CD4 count
and ≥ 45 years, respectively), in males (OR 2.45) and amongst monitoring subsequent to ART initiation in order to identify
patients with TB (OR 3.57; Table 1). The odds of immunological INRs who require extra clinical care. Efforts should focus on
non-response were significantly lower amongst patients with older patients, males and those starting ART with low
baseline CD4 > 350 cells/mm compared with CD4 ≤ 350 (OR baseline CD4, as has been previously demonstrated, 3,4,5,6,7 as
3
0.32). In multivariate analysis, INR remained significantly well as PLHIV with TB coinfection. It is concerning that low
more likely amongst patients on second-line ART (adjusted baseline CD4 is significantly associated with immunological
OR [aOR] 1.79), those aged 35–45 and ≥ 45 years (aOR 1.15 non-response, as a notable proportion of patients initiating
and 1.50, respectively), males (aOR 2.28) and patients with ART in South Africa do so with low CD4 counts. In particular,
2
confirmed TB (aOR 2.49). The odds of INR also remained older patients and males are more likely to present late for
significantly less likely amongst patients with higher baseline HIV care with low baseline CD4, which may contribute to
2
CD4 (aOR 0.35).
the poor CD4 recovery of these patients. Continued
Discussion engagement with communities, particularly with men and
older clients, is required to emphasise the importance of
This study of routine data from four South African districts engaging with ART services before CD4 counts have dropped
demonstrates poor implementation of CD4 testing substantially. The association between INR and second- or
subsequent to ART initiation and a notable proportion of third-line regimens may be because of prolonged viral non-
patients with low CD4 counts even after initiating ART. suppression associated with treatment failure. It is possible
Amongst patients on ART for 12–18 months who should that low CD4 counts are a result of delayed switching from a
have received a routine 12-month CD4 test according to failing to effective regimen, which would need to be further
national guidelines, less than one quarter had a post-baseline investigated.
8
TABLE 1: Characteristics of immunological non-responders (CD4 count ≤ 350 cells/mm ) compared with immunological responders (CD4 count > 350 cells/mm ) amongst
3
3
patients with a suppressed viral load who had been on ART for more than 4 years.
Variables Immunological non-responder, Immunological responder, Unadjusted OR Adjusted OR†
n = 18 556 n = 74 134
n % n % OR (95% CI) p-value OR (95% CI) p
Last ART regimen
First line 13 615 18.3 60 709 81.7 Ref Ref
Second line 2208 29.5 5282 70.5 1.85 (1.76–1.96) < 0.001 1.79 (1.68–1.91) < 0.001
Third line 34 26.6 94 73.4 1.54 (1.04–2.28) 0.031 1.41 (0.85–2.35) 0.188
Unassigned 22 22.5 76 77.6 1.22 (0.76–1.97) 0.403 0.83 (0.44–1.59) 0.581
Age at ART start, years
15–25 1104 15.4 6073 84.6 Ref Ref
25–35 5836 16.9 28 748 83.1 1.12 (1.04–1.20) 0.001 0.99 (0.90–1.09) 0.886
35–45 6662 21.1 24 851 78.9 1.49 (1.39–1.60) < 0.001 1.15 (1.05–1.27) 0.003
≥ 45 4954 25.5 14 462 74.5 1.93 (1.80–2.08) < 0.001 1.50 (1.37–1.66) < 0.001
Gender
Female 9902 15.3 54 749 84.7 Ref Ref
Male 8654 30.9 19 385 69.1 2.45 (2.37–2.53) < 0.001 2.28 (2.19–2.38) < 0.001
Baseline CD4, cells/mm 3
≤ 350 13 831 21.6 50 266 78.4 Ref Ref
> 350 664 8.0 7669 92.0 0.32 (0.29–0.34) < 0.001 0.35 (0.32–0.38) < 0.001
TB status
None/unknown 18 393 19.9 73 955 80.1 Ref Ref
Confirmed TB 163 47.7 179 52.3 3.57 (2.88–4.42) < 0.001 2.49 (1.81–3.43) < 0.001
ART, antiretroviral therapy; CI, confidence interval; OR, odds ratio; Ref, reference; TB, tuberculosis.
Data are n (%). Total value differs between variables because of missing data.
Statistically significant differences are shown in bold.
†, Mixed effects logistic regression for characteristics of immunological non-responders, adjusting for random effects at the district level. Fixed effects covariates include ART regimen level, age at
ART start, gender, baseline CD4 count and TB status.
http://www.sajhivmed.org.za 248 Open Access