
Page 399 - SAHCS HIVMed Journal Vol 20 No 1 2019
P. 399
Page 4 of 7 Original Research
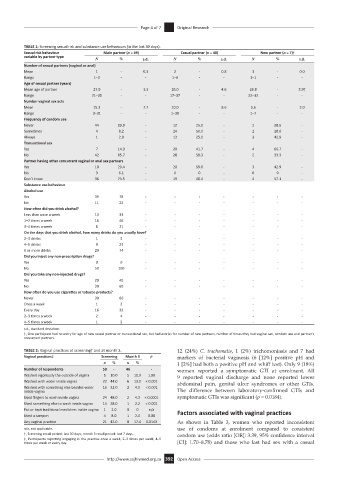
TABLE 1: Screening sexual risk and substance use behaviours (in the last 30 days).
Sexual risk behaviour Main partner (n = 49) Casual partner (n = 48) New partner (n = 7)†
variable by partner type N % s.d. N % s.d. N % s.d.
Number of sexual partners (vaginal or anal)
Mean 1 - 0.3 2 - 0.8 1 - 0.0
Range 1–3 - - 1–4 - - 1–1 - -
Age of sexual partner (years)
Mean age of partner 27.0 - 3.3 26.0 - 4.6 26.8 - 3.9†
Range 21–35 - - 17–37 - - 22–32 - -
Number vaginal sex acts
Mean 15.3 - 7.7 10.0 - 8.6 3.6 - 2.0
Range 3–31 - - 1–38 - - 1–7 - -
Frequency of condom use
Never 44 89.8 - 12 25.0 - 2 28.6 -
Sometimes 4 8.2 - 24 50.0 - 2 28.6 -
Always 1 2.0 - 12 25.0 - 3 42.9 -
Transactional sex
Yes 7 14.3 - 20 41.7 - 4 66.7 -
No 42 85.7 - 28 58.3 - 2 33.3 -
Partner having other concurrent vaginal or anal sex partners
Yes 10 20.4 - 28 59.6 - 3 42.9 -
No 3 6.1 - 0 0 - 0 0 -
Don’t know 36 73.5 - 19 40.4 - 4 57.1 -
Substance use behaviour
Alcohol use
Yes 39 78 - - - - - - -
No 11 22 - - - - - - -
How often did you drink alcohol?
Less than once a week 13 33 - - - - - - -
1–2 times a week 18 46 - - - - - - -
3–4 times a week 8 21 - - - - - - -
On the days that you drink alcohol, how many drinks do you usually have?
2–3 drinks 1 3 - - - - - - -
4–5 drinks 9 23 - - - - - - -
6 or more drinks 29 74 - - - - - - -
Did you inject any non-prescription drugs?
Yes 0 0 - - - - - - -
No 50 100 - - - - - - -
Did you take any non-injected drugs?
Yes 20 40 - - - - - - -
No 30 60 - - - - - - -
How often do you use cigarettes or tobacco products?
Never 30 60 - - - - - - -
Once a week 1 2 - - - - - - -
Every day 16 32 - - - - - - -
2–3 times a week 2 4 - - - - - - -
4–5 times a week 1 2 - - - - - - -
s.d., standard deviation.
†, One participant had no entry for age of new sexual partner or transactional sex, but had entries for number of new partners, number of times they had vaginal sex, condom use and partner’s
concurrent partners.
TABLE 2: Vaginal practices at screening† and at month 3. 12 (24%) C. trachomatis, 1 (2%) trichomoniasis and 7 had
Vaginal practices‡ Screening Month 3 p markers of bacterial vaginosis (6 [12%] positive pH and
n % n % 1 [2%] had both a positive pH and whiff test). Only 9 (18%)
Number of respondents 50 - 46 - women reported a symptomatic GTI at enrolment. All
Washed vigorously the outside of vagina 5 10.0 5 10.9 1.00 9 reported vaginal discharge and none reported lower
Washed with water inside vagina 22 44.0 6 13.0 < 0.001 abdominal pain, genital ulcer syndromes or other GTIs.
Washed with something else besides water 16 32.0 2 4.0 < 0.001
inside vagina The difference between laboratory-confirmed GTIs and
Used fingers to wash inside vagina 24 48.0 2 4.3 < 0.0001 symptomatic GTIs was significant (p = 0.0184).
Used something else to wash inside vagina 14 28.0 1 2.2 < 0.001
Put or kept traditional medicines inside vagina 1 2.0 0 0 n/a Factors associated with vaginal practices
Used a tampon 4 8.0 1 2.0 0.08
Any vaginal practice 21 42.0 8 17.4 0.0143 As shown in Table 3, women who reported inconsistent
n/a, not applicable. use of condoms at enrolment compared to consistent
†, Screening recall period: last 30 days; month 3 recall period: last 7 days. condom use (odds ratio [OR]: 3.39, 95% confidence interval
‡, Participants reporting engaging in the practice once a week, 2–3 times per week, 4–5
times per week or every day. [CI]: 1.70–8.78) and those who last had sex with a casual
http://www.sajhivmed.org.za 392 Open Access