
Page 385 - SAHCS HIVMed Journal Vol 20 No 1 2019
P. 385
Page 4 of 6 Original Research
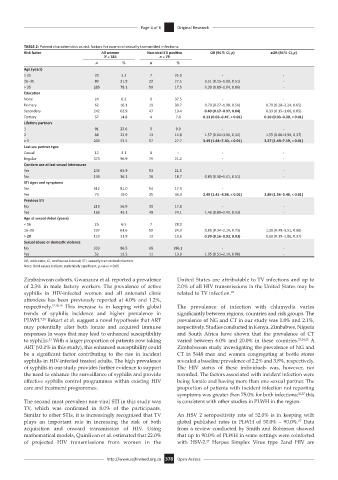
TABLE 2: Patient characteristics as risk factors for non-viral sexually transmitted infections.
Risk factor All women Non-viral STI positive OR (95% CI, p) aOR (95% CI, p)
N = 385 n = 79
n % n %
Age (years)
≤ 25 20 5.2 7 35.0 - -
26–35 80 21.9 22 27.5 0.51 (0.25–1.99, 0.51) -
> 35 285 78.1 50 17.5 0.39 (0.09–1.04, 0.06) -
Education
None 24 6.2 9 37.5 - -
Primary 62 16.1 19 30.7 0.73 (0.27–1.98, 0.54) 0.79 (0.28–2.24, 0.65)
Secondary 242 62.9 47 19.4 0.40 (0.17–0.97, 0.04) 0.39 (0.15–1.00, 0.05)
Tertiary 57 14.8 4 7.0 0.13 (0.03–0.47, < 0.01) 0.10 (0.03–0.39, < 0.01)
Lifetime partners
1 91 23.6 9 9.9 - -
2 88 22.9 13 14.8 1.57 (0.64–3.90, 0.32) 1.55 (0.60–3.99, 0.37)
≥ 3 206 53.5 57 27.7 3.49 (1.64–7.40, < 0.01) 3.27 (1.49–7.19, < 0.01)
Last sex partner type
Casual 12 3.1 0 - - -
Regular 373 96.9 79 21.2 - -
Condom use at last sexual intercourse
Yes 246 63.9 53 21.5 - -
No 139 36.1 26 18.7 0.83 (0.50–1.41, 0.51) -
STI signs and symptoms
No 312 81.0 54 17.3 -
Yes 73 19.0 25 34.3 2.49 (1.41–4.38, < 0.01) 2.89 (1.54–5.40, < 0.01)
Previous STI
No 219 56.9 39 17.8 - -
Yes 166 43.1 40 24.1 1.46 (0.89–2.40, 0.13) -
Age at sexual debut (years)
< 16 25 6.5 7 28.0 - -
16–20 237 61.6 59 24.9 0.85 (0.34–2.14, 0.73) 1.30 (0.49–3.51, 0.60)
> 20 123 31.9 13 10.6 0.39 (0.16–0.93, 0.03) 0.60 (0.19–1.86, 0.37)
Sexual abuse or domestic violence
No 333 86.5 68 (86.1 - -
Yes 52 13.5 11 13.9 1.05 (0.51–2.14, 0.90) -
OR, odds ratio; CI, confidence interval; STI, sexually transmitted infection.
Note: Bold values indicate statistically significant, p-value < 0.05
Zimbabwean cohorts. Gwanzura et al. reported a prevalence United States are attributable to TV infections and up to
of 2.3% in male factory workers. The prevalence of active 2.0% of all HIV transmissions in the United States may be
syphilis in HIV-infected women and all antenatal clinic related to TV infection. 22
attendees has been previously reported at 4.0% and 1.2%,
respectively. 17,18,19 This increase is in keeping with global The prevalence of infection with chlamydia varies
trends of syphilis incidence and higher prevalence in significantly between regions, countries and risk groups. The
PLWH. 7,20 Rekart et al. suggest a novel hypothesis that ART prevalence of NG and CT in our study was 1.8% and 2.1%,
may potentially alter both innate and acquired immune respectively. Studies conducted in Kenya, Zimbabwe, Nigeria
responses in ways that may lead to enhanced susceptibility and South Africa have shown that the prevalence of CT
21
to syphilis. With a larger proportion of patients now taking varied between 6.0% and 20.0% in these countries. 23,24,25 A
ART (93.0% in this study), this enhanced susceptibility could Zimbabwean study investigating the prevalence of NG and
be a significant factor contributing to the rise in incident CT in 5448 men and women congregating at bottle stores
syphilis in HIV-infected treated adults. The high prevalence revealed a baseline prevalence of 2.2% and 3.8%, respectively.
of syphilis in our study provides further evidence to support The HIV status of these individuals was, however, not
the need to enhance the surveillance of syphilis and provide recorded. The factors associated with incident infection were
effective syphilis control programmes within existing HIV being female and having more than one sexual partner. The
care and treatment programmes. proportion of patients with incident infection not reporting
symptoms was greater than 75.0% for both infections; 26,27 this
The second most prevalent non-viral STI in this study was is consistent with other studies in PLWH in the region.
TV, which was confirmed in 8.0% of the participants.
Similar to other STIs, it is increasingly recognised that TV An HSV 2 seropositivity rate of 52.0% is in keeping with
27
plays an important role in increasing the risk of both global published rates in PLWH of 50.0% – 90.0%. Data
acquisition and onward transmission of HIV. Using from a review conducted by Smith and Robinson showed
mathematical models, Quinlivan et al. estimated that 22.0% that up to 90.0% of PLWH in some settings were coinfected
27
of projected HIV transmissions from women in the with HSV-2. Herpes Simplex Virus type 2and HIV are
http://www.sajhivmed.org.za 378 Open Access