
Page 296 - SAHCS HIVMed Journal Vol 20 No 1 2019
P. 296
Page 3 of 6 Original Research
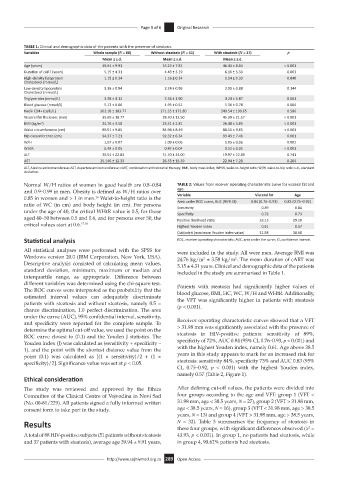
TABLE 1: Clinical and demographic data of the patients with the presence of steatosis.
Variables Whole sample (N = 88) Without steatosis (N = 51) With steatosis (N = 37) p
Mean ± s.d. Mean ± s.d. Mean ± s.d.
Age (years) 39.94 ± 9.91 35.23 ± 7.81 46.43 ± 8.84 < 0.001
Duration of cART (years) 5.15 ± 4.31 4.43 ± 3.29 6.16 ± 5.30 0.063
High-density lipoprotein 1.15 ± 0.34 1.16 ± 0.34 1.14 ± 0.33 0.840
Cholesterol (mmol/L)
Low-density lipoprotein 3.36 ± 0.94 3.24 ± 0.96 3.55 ± 0.88 0.144
Cholesterol (mmol/L)
Triglycerides (mmol/L) 3.28 ± 4.12 2.58 ± 1.90 4.24 ± 5.87 0.061
Blood glucose (mmol/L) 5.12 ± 0.66 4.95 ± 0.51 5.36 ± 0.78 0.004
Nadir CD4+ (cells/L) 262.18 ± 183.77 271.35 ± 172.80 249.54 ± 199.65 0.586
Visceral fat thickness (mm) 35.60 ± 18.77 28.50 ± 12.50 45.39 ± 21.57 < 0.001
BMI (kg/m ) 2 24.76 ± 3.58 23.51 ± 2.81 26.48 ± 3.85 < 0.001
Waist circumference (cm) 88.51 ± 9.85 84.94 ± 8.49 88.51 ± 9.85 < 0.001
Hip circumference (cm) 94.37 ± 7.21 92.32 ± 6.34 93.43 ± 7.46 0.001
W/H 1.07 ± 0.07 1.09 ± 0.06 1.05 ± 0.06 0.002
WHtR 0.49 ± 0.05 0.47 ± 0.04 0.52 ± 0.05 < 0.001
ALT 30.54 ± 22.83 31.70 ± 24.00 19.97 ± 22.89 0.741
AST 25.146 ± 12.33 26.53 ± 15.39 22.94 ± 7.28 0.204
ALT, Alanine aminotransferase; AST, Aspartate aminotransferase; cART, combination antiretroviral therapy; BMI, body mass index; WHtR, waist-to-height ratio; W/H, waist-to-hip ratio; s.d., standard
deviation.
Normal W/H ratios of women in good health are 0.8–0.84 TABLE 2: Values from receiver operating characteristic curve for visceral fat and
and 0.9–0.99 in men. Obesity is defined as W/H ratios over age.
Age
Visceral fat
0.85 in women and > 1 in men. Waist-to-height ratio is the Variable 0.84 (0.76–0.93) 0.83 (0.75–0.92)
16
Area under ROC curve, AUC (95% CI)
ratio of WC (in cm) and body height (in cm). For persons Sensitivity 0.89 0.84
under the age of 40, the critical WHtR value is 0.5, for those Specificity 0.72 0.73
aged 40–50 between 0.5 and 0.6, and for persons over 50, the Positive likelihood ratio 33.13 29.20
critical values start at 0.6. 17,18 Highest Youden index 0.61 0.57
Cut/point (maximum Youden index value) 31.98 38.50
Statistical analysis ROC, receiver operating characteristic; AUC, area under the curve; CI, confidence interval.
All statistical analyses were performed with the SPSS for were included in the study. All were men. Average BMI was
Windows version 20.0 (IBM Corporation, New York, USA). 24.76 kg/m ± 3.58 kg/m . The mean duration of cART was
2
2
Descriptive analysis consisted of calculating mean values, 5.15 ± 4.31 years. Clinical and demographic data of the patients
standard deviation, minimum, maximum or median and included in the study are summarised in Table 1.
interquartile range, as appropriate. Difference between
different variables was determined using the chi-square test. Patients with steatosis had significantly higher values of
The ROC curves were interpreted as the probability that the blood glucose, BMI, HC, WC, W/H and WHtR. Additionally,
estimated interval values can adequately discriminate
patients with steatosis and without steatosis, namely 0.5 = the VFT was significantly higher in patients with steatosis
(p < 0.001).
chance discrimination, 1.0 perfect discrimination. The area
under the curve (AUC), 95% confidential interval, sensitivity,
and specificity were reported for the complete sample. To Receiver operating characteristic curves showed that a VFT
determine the optimal cut-off value, we used the point on the > 31.98 mm was significantly associated with the presence of
ROC curve closest to (0.1) and the Youden J statistics. The steatosis in HIV-positive patients: sensitivity of 89%,
Youden index (J) was calculated as (sensitivity + specificity – specificity of 72%, AUC 0.84 (95% CI, 0.76–0.93, p < 0.001) and
1), and the point with the shortest distance value from the with the highest Youden index, namely 0.61. Age above 38.5
point (0.1) was calculated as [(1 × sensitivity)/2 + (1 × years in this study appears to mark for an increased risk for
specificity)/2]. Significance value was set at p < 0.05. steatosis: sensitivity 84%, specificity 73% and AUC 0.83 (95%
CI, 0.75–0.92, p < 0.001) with the highest Youden index,
namely 0.57 (Table 2, Figure 1).
Ethical consideration
The study was reviewed and approved by the Ethics After defining cut-off values, the patients were divided into
Committee of the Clinical Centre of Vojvodina in Novi Sad four groups according to the age and VFT: group 1 (VFT <
(No. 00-81/229). All patients signed a fully informed written 31.98 mm, age < 38.5 years, N = 27), group 2 (VFT > 31.98 mm,
consent form to take part in the study. age < 38.5 years, N = 16), group 3 (VFT < 31.98 mm, age > 38.5
years, N = 13) and group 4 (VFT > 31.98 mm, age > 38.5 years,
Results N = 32). Table 3 summarises the frequency of steatosis in
these four groups, with significant differences observed (x =
2
A total of 88 HIV-positive subjects (51 patients without steatosis 43.93, p < 0.001). In group 1, no patients had steatosis, while
and 37 patients with steatosis), average age 39.94 ± 9.91 years, in group 4, 90.62% patients had steatosis.
http://www.sajhivmed.org.za 289 Open Access