
Page 164 - SAHCS HIVMed Journal Vol 20 No 1 2019
P. 164
Page 9 of 14 Original Research
TABLE 5: Adherence to medication distribution rates in two adherence clubs at
Adherence club Facility Y.
Club B Club A Adherence Total Number of patients Adhering patients
Club B-censored Club A-censored club number non-adherent to ART
Number %
Survival func ons Club A 35 8 27 77.1
Club B 37 4 33 89.2
1.0
Overall 72 12 60 83.3
0.8
Adherence clubs
Club A Club B
Club A-censored Club B-censored
Cum survival 0.4 Survival func ons
0.6
1.0
0.2
0.8
0
0 5 10 15 20 25 0.6
Time to treatment default (months) Cum survival
FIGURE 2: Survival distribution of patient retention in care in two adherence 0.4
clubs at Facility Y.
0.2
in care rates at 6, 12 and 24 months with values of 86.5%
(95% CI, 70.4–94.9), 83.8% (95% CI, 67.3–93.2) and 81.1%
(95% CI, 64.3–91.4), respectively. Fox et al. estimated a 6-year 0
national retention in ART care in South Africa at 63.3%.
38
Comparing this value to the overall retention in care value of
Facility Y (77.8%), we suggested the 2-year retention in care 0 5 10 15 20 25
rate of the facility is good. Annual viral load measurements
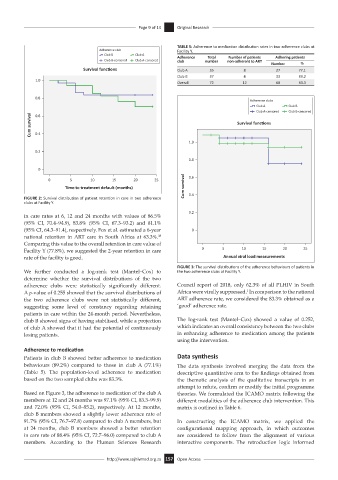
FIGURE 3: The survival distributions of the adherence behaviours of patients in
We further conducted a log-rank test (Mantel–Cox) to the two adherence clubs at Facility Y.
determine whether the survival distributions of the two
adherence clubs were statistically significantly different. Council report of 2018, only 62.3% of all PLHIV in South
1
A p-value of 0.255 showed that the survival distributions of Africa were virally suppressed. In comparison to the national
the two adherence clubs were not statistically different, ART adherence rate, we considered the 83.3% obtained as a
suggesting some level of constancy regarding retaining ‘good’ adherence rate.
patients in care within the 24-month period. Nevertheless,
club B showed signs of having stabilised, while a projection The log-rank test (Mantel–Cox) showed a value of 0.252,
of club A showed that it had the potential of continuously which indicates an overall consistency between the two clubs
losing patients. in enhancing adherence to medication among the patients
using the intervention.
Adherence to medication
Patients in club B showed better adherence to medication Data synthesis
behaviours (89.2%) compared to those in club A (77.1%) The data synthesis involved merging the data from the
(Table 5). The population-level adherence to medication descriptive quantitative arm to the findings obtained from
based on the two sampled clubs was 83.3%. the thematic analysis of the qualitative transcripts in an
attempt to refute, confirm or modify the initial programme
Based on Figure 3, the adherence to medication of the club A theories. We formulated the ICAMO matrix following the
members at 12 and 24 months was 97.1% (95% CI, 83.3–99.9) different modalities of the adherence club intervention. This
and 72.0% (95% CI, 54.0–85.2), respectively. At 12 months, matrix is outlined in Table 6.
club B members showed a slightly lower adherence rate of
91.7% (95% CI, 76.7–97.8) compared to club A members, but In constructing the ICAMO matrix, we applied the
at 24 months, club B members showed a better retention configurational mapping approach, in which outcomes
in care rate of 88.4% (95% CI, 72.7–96.0) compared to club A are considered to follow from the alignment of various
members. According to the Human Sciences Research interactive components. The retroduction logic informed
http://www.sajhivmed.org.za 157 Open Access