
Page 152 - SAHCS HIVMed Journal Vol 20 No 1 2019
P. 152
Page 5 of 8 Original Research
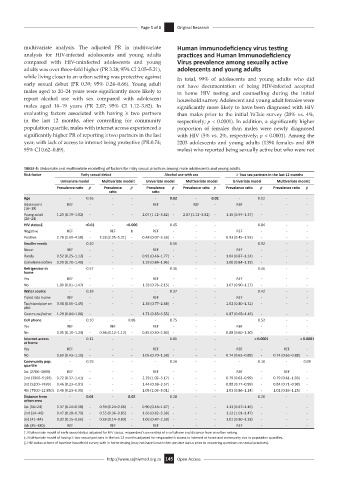
multivariate analysis. The adjusted PR in multivariate Human immunodeficiency virus testing
analysis for HIV-infected adolescents and young adults practices and Human Immunodeficiency
compared with HIV-uninfected adolescents and young Virus prevalence among sexually active
adults was over three-fold higher (PR 3.28; 95% CI 2.05–5.21), adolescents and young adults
while living closer to an urban setting was protective against In total, 99% of adolescents and young adults who did
early sexual debut (PR 0.39; 95% 0.24–0.66). Young adult not have documentation of being HIV-infected accepted
males aged to 20–24 years were significantly more likely to in home HIV testing and counselling during the initial
report alcohol use with sex compared with adolescent household survey. Adolescent and young adult females were
males aged 16–19 years (PR 2.07; 95% CI 1.12–3.82). In significantly more likely to have been diagnosed with HIV
evaluating factors associated with having ≥ two partners than males prior to the initial YaTsie survey (20% vs. 4%,
in the last 12 months, after controlling for community respectively; p < 0.0001). In addition, a significantly higher
population quartile, males with internet access experienced a proportion of females than males were newly diagnosed
significantly higher PR of reporting ≥ two partners in the last with HIV (5% vs. 2%, respectively; p < 0.0001). Among the
year, with lack of access to internet being protective (PR:0.74; 2203 adolescents and young adults (1394 females and 809
95% CI 0.62–0.89). males) who reported being sexually active but who were not
TABLE 4: Univariate and multivariate modelling of factors for risky sexual practices among male adolescents and young adults.
Risk factor Early sexual debut Alcohol use with sex ≥ Two sex partners in the last 12 months
Univariate model Multivariate model† Univariate model Multivariate model Univariate model Multivariate model‡
Prevalence ratio p Prevalence p Prevalence p Prevalence ratio p Prevalence ratio p Prevalence ratio p
ratio ratio
Age - 0.36 - - - 0.02 - 0.02 - 0.12 - -
Adolescent REF - - - REF - REF - REF - - -
(16–19)
Young adult 1.23 (0.79–1.92) - - - 2.07 (1.12–3.82) - 2.07 (1.12–3.82) - 1.15 (0.97–1.37) - - -
(20–24)
HIV status§ - <0.01 - <0.000 - 0.45 - - 0.84 - -
Negative REF - REF 1 REF - - - REF - - -
Positive 2.78 (1.69–4.58) - 3.28 (2.05–5.21) - 0.48 (0.07–3.28) - - - 0.93 (0.45–1.92) - - -
Smaller meals - 0.20 - - - 0.56 - - 0.92 - -
Never REF - - REF - - - REF - - -
Rarely 0.52 (0.25–1.12) - - - 0.92 (0.48–1.77) - - - 1.04 (0.87–1.24) - - -
Sometimes/often 0.99 (0.70–1.40) - - - 1.29 (0.84–1.96) - - - 1.00 (0.84–1.19) - - -
Refrigerator in - 0.57 - - - 0.36 - - 0.46 - -
home
Yes REF - - - REF - - - REF - - -
No 1.09 (0.81–1.47) - - - 1.28 (0.76–2.15) - - - 1.07 (0.90–1.27) - - -
Water source - 0.39 - - - 0.37 - - 0.42 - -
Piped into home REF - - - REF - - - REF - - -
Tap/standpipe on 0.98 (0.66–1.45) - - - 1.38 (0.77–2.48) - - - 1.02 (0.80–1.31) - - -
plot
Communal/other 1.29 (0.84–1.96) - - - 1.73 (0.85–3.55) - - - 0.87 (0.65–1.16) - - -
Cell phone - 0.10 - 0.08 - 0.75 - - 0.52 - -
Yes REF - REF - REF - - - REF - - -
No 0.35 (0.10–1.23) - 0.36 (0.12–1.12) - 0.85 (0.30–2.40) - - - 0.88 (0.60–1.30) - - -
Internet access - 0.12 - - - 0.81 - - - < 0.0001 - < 0.0001
at home
Yes REF - - - REF - - - REF - REF -
No 0.69 (0.43–1.10) - - - 1.05 (0.70–1.58) - - - 0.74 (0.62–0.89) - 0.74 (0.62–0.88) -
Community pop. - 0.29 - - - 0.24 - - - 0.10 - 0.09
quartile
1st (2700–3899) REF - - - REF - - - REF - REF -
2nd (3900–5199) 0.72 (0.37–1.41) -- - - 2.29 (1.02–5.17) - - - 0.79 (0.63–0.99) - 0.79 (0.61–1.03) -
3rd (5200–7499) 0.46 (0.23–0.91) - - - 1.44 (0.58–3.57) - - - 0.88 (0.77–0.99) - 0.84 (0.71–0.98) -
4th (7500–12 850) 0.46 (0.23–0.95) - - - 1.05 (1.03–5.01) - - - 1.03 (0.86–1.24) - 1.02 (0.83–1.25) -
Distance from - 0.04 - 0.02 0.28 - - 0.20 - -
urban area
1st (18–24) 0.37 (0.24–0.58) - 0.39 (0.24–0.66) - 0.90 (0.48–1.67) - - - 1.13 (0.87–1.46) - - -
2nd (24–40) 0.47 (0.28–0.79) - 0.55 (0.36–0.85) - 1.66 (0.82–3.38) - - - 1.22 (1.01–1.47) - - -
3rd (41–84) 0.32 (0.15–0.66) - 0.33 (0.14–0.80) - 1.06 (0.47–2.38) - - - 1.01 (0.80–1.28) - - -
4th (85–380) REF - REF - REF - - - REF - - -
†, Multivariate model of early sexual debut adjusted for HIV status, respondent’s ownership of a cell phone and distance from an urban setting.
‡, Multivariate model of having ≥ two sexual partners in the last 12 months adjusted for respondent’s access to internet at home and community size in population quartiles.
§, HIV status at time of baseline household survey with in home testing (may not have known their positive status prior to answering questions on sexual practices).
http://www.sajhivmed.org.za 145 Open Access