
Page 151 - SAHCS HIVMed Journal Vol 20 No 1 2019
P. 151
Page 4 of 8 Original Research
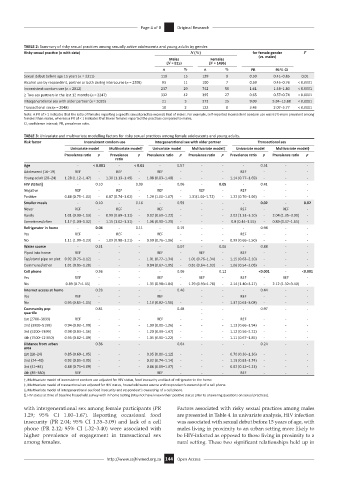
TABLE 2: Summary of risky sexual practices among sexually active adolescents and young adults by gender.
Risky sexual practice (n with data) N (%) for female gender P
Males Females (vs. males)
(N = 815) (N = 1496)
n % n % PR 95% CI
Sexual debut before age 15 years (n = 2311) 119 15 129 9 0.59 0.41–0.85 0.01
Alcohol use by respondent, partner or both during intercourse (n = 2308) 93 11 100 7 0.59 0.45–0.76 < 0.0001
Inconsistent condom use (n = 2012) 237 29 742 50 1.61 1.44–1.80 < 0.0001
≥ Two sex partners in the last 12 months (n = 2247) 332 42 395 27 0.65 0.57–0.74 < 0.0001
Intergenerational sex with older partner (n = 2028) 21 3 373 25 9.00 5.84–13.88 < 0.0001
Transactional sex (n = 2048) 18 2 122 8 3.46 2.07–5.77 < 0.0001
Note: A PR of > 1 indicates that the ratio of females reporting a specific sexual practice exceeds that of males. For example, self-reported inconsistent condom use was 61% more prevalent among
females than males, whereas a PR of < 1 indicates that fewer females reported the practices compared to males.
CI, confidence interval; PR, prevalence ratio.
TABLE 3: Univariate and multivariate modelling factors for risky sexual practices among female adolescents and young adults.
Risk factor Inconsistent condom use Intergenerational sex with older partner Transactional sex
Univariate model Multivariate model† Univariate model Multivariate model‡ Univariate model Multivariate model§
Prevalence ratio p Prevalence p Prevalence ratio p Prevalence ratio p Prevalence ratio p Prevalence ratio p
ratio
Age - < 0.001 - < 0.01 - 0.57 - - - 0.51 - -
Adolescent (16–19) REF - REF - REF - - - REF - - -
Young adult (20–24) 1.28 (1.12–1.47) - 1.30 (1.13–1.49) - 1.08 (0.83–1.40) - - - 1.14 (0.77–1.69) - - -
HIV status¶ - 0.10 - 0.09 - 0.06 - 0.05 - 0.41 - -
Negative REF - REF - REF - REF - REF - - -
Positive 0.88 (0.75–1.03) - 0.87 (0.74–1.02) - 1.29 (1.00–1.67) - 1.31(1.00–1.72) - 1.22 (0.76–1.96) - - -
Smaller meals - 0.10 - 0.16 - 0.59 - - - 0.02 - 0.02
Never REF - REF - REF - - - REF - REF -
Rarely 1.01 (0.90–1.13) - 0.99 (0.89–1.11) - 0.92 (0.69–1.22) - - - 2.02 (1.31–3.10) - 2.04 (1.35–3.09) -
Sometimes/often 1.17 (1.04–1.32) - 1.15 (1.02–1.31) - 1.08 (0.90–1.29) - - - 0.8 (0.44–1.55) - 0.89 (0.47–1.65) -
Refrigerator in home - 0.04 - 0.11 - 0.19 - - - 0.98 - -
Yes REF - REF - REF - - - REF - - -
No 1.11 (1.00–1.23) - 1.09 (0.98–1.21) - 0.90 (0.76–1.06) - - - 0.99 (0.66–1.50) - - -
Water source - 0.21 - - - 0.07 - 0.06 - 0.88 - -
Piped into home REF - - - REF - REF - REF - - -
Tap/stand pipe on plot 0.92 (0.75–1.12) - - - 1.01 (0.77–1.34) - 1.01 (0.76–1.34) - 1.15 (0.63–2.10) - - -
Communal/other 1.01 (0.85–1.20) - - - 0.84 (0.67–1.05) - 0.81 (0.64–1.03) - 1.06 (0.54–2.08) - - -
Cell phone - 0.36 - - - 0.06 - 0.12 - <0.001 - <0.001
Yes REF - - - REF - REF - REF - REF -
No 0.89 (0.7–1.15) - - - 1.35 (0.98–1.84) - 1.29 (0.93–1.78) - 2.14 (1.40–3.27) - 2.12 (1.32–3.40) -
Internet access at home 0.28 - - - 0.46 - - - 0.44 - -
Yes REF - - - REF - - REF - - -
No 0.95 (0.85–1.05) - - - 1.13 (0.82–1.56) - - - 1.37 (0.61–3.08) - - -
Community pop 0.81 - - - 0.48 - - - 0.97 - -
quartile -
1st (2700–3899) REF - - - REF - - - REF - - -
2nd (3900–5199) 0.94 (0.82–1.09) - - - 1.00 (0.80–1.26) - - - 1.13 (0.66–1.94) - - -
3rd (5200–7499) 0.98 (0.83–1.16) - - - 1.20 (0.99–1.47) - - - 1.12 (0.56–2.22) - - -
4th (7500–12 850) 0.95 (0.82–1.09) - - - 1.05 (0.90–1.22) - - - 1.11 (0.67–1.85) - - -
Distance from urban 0.36 - - 0.64 - - - 0.24 - -
area
1st (18–24) 0.85 (0.69–1.05) - - - 0.95 (0.80–1.12) - - - 0.70 (0.36–1.36) - - -
2nd (24–40) 0.92 (0.81–1.05) - - - 0.92 (0.74–1.14) - - - 1.19 (0.81–1.74) - - -
3rd (41–84) 0.88 (0.71–1.09) - - - 0.86 (0.69–1.07) - - - 0.62 (0.32–1.23) - - -
4th (85–380) REF - - - REF - - - REF - - -
†, Multivariate model of inconsistent condom use adjusted for HIV status, food insecurity and lack of refrigerator in the home.
‡, Multivariate model of transactional sex adjusted for HIV status, household water source and respondent’s ownership of a cell phone.
§, Multivariate model of intergenerational sex food insecurity and respondent’s ownership of a cell phone.
¶, HIV status at time of baseline household survey with in home testing (May not have known their positive status prior to answering questions on sexual practices).
with intergenerational sex among female participants (PR Factors associated with risky sexual practices among males
1.29; 95% CI 1.00–1.67). Reporting occasional food are presented in Table 4. In univariate analysis, HIV infection
insecurity (PR 2.04; 95% CI 1.35–3.09) and lack of a cell was associated with sexual debut before 15 years of age, with
phone (PR 2.12; 95% CI 1.32–3.40) were associated with males living in proximity to an urban setting more likely to
higher prevalence of engagement in transactional sex be HIV-infected as opposed to those living in proximity to a
among females. rural setting. These two significant relationships held up in
http://www.sajhivmed.org.za 144 Open Access